How To
Summary
Power Systems gain there massive performance with lots a technology this series details many of them.
Objective
Originally, written in 2012 for the DeveloperWorks AIXpert Blog for POWER7 but updated in 2019 for POWER8 and POWER9.
Steps
So you know about Local, Near and Far memory, from the first blog in this series, for your actual machine but what is your Virtual Machine (LPAR) actually using? There are three key commands to show you (lssrad, mpstat and topas) and we will look at some example output.
First, we need to define an SRAD or a Scheduler Resource Affinity Domain. If you have used Resource Sets with AIX WLM or WPAR then you have a good idea what these are like. An SRAD is a group of resources but in our case CPU/cores and the associated memory that is directly attached to it. As an example to help make this real, an SRAD might have logical CPUs 4, 5, 6 and 7 (i.e. the logical CPUs of the second physical CPU/core) and 28 GB of memory. With a process that is running in this SRAD, any memory it gets allocated at start p time or later on with malloc() with be assigned to the 28 GB's of memory in the SRAD. Well, if there is available memory that will happen in a worst case AIX may be forces to allocate memory further away. In fact, the process ID (PID) includes the SRAD number (it makes up a few bits 8 to 11 in the middle) and helps explain the large PID values AIX uses but you don't really need to know that! Of course, an SRAD, could contain many logical CPUs as each POWER7 chip has up to 8 CPU cores and POWER8/POWER9 up to 12 CPU cores.
lssrad -ax
- Follow this link to the manual page for the lssrad command
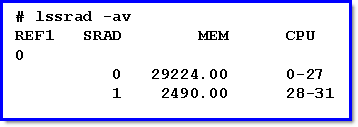
Fortunately, the lssrad command gives you a clear view of the logical layout of your Virtual Machine (LPAR). Here is a simple from my Power 770:

There is no need to explain the lssrad options as all the others are IMHO pointless :-)
So let me explain what we have here
- REF1 means the first node that the Virtual Machine is on
- Small machine = system planar and only ever REF0,
- Power 770/780 = the four CEC drawers of the large configuration machine (REF1 ranges from 0 to 3) and on the
- Power 795 = the maximum 8 CPU books (REF1 ranges from 0 to 7).
- Why REF1? REF is short for Reference but beyond that is mystery to me!
- SRAD means the Scheduler Resource Affinity Domain and are the groups of processors and memory numbered from zero.
- MEM means memory (of course) and it is not obvious but this is reported in Megabytes!
- CPU means the logical CPU numbers, also called CPU core threads.
So we can see:
- There is only one REF1 - so the whole VM is within one of my two CEC drawers within my Power 770
- SRAD0 has ~28GB of memory and 28 logical CPUs (0 to 27) and assuming SMT=4 that is 7 physical CPU/cores
- SRAD1 has ~2.5GB of memory and 4 logical CPUs (28 to 31) and assuming SMT=4 that is 1 physical CPU/cores
We can also assume that when the VM was started that the fist POWER chip already had one core allocated to a different VM and so this one was spread across two POWER chips. Processes started on the first POWER chip in SRAD0 will (hopefully) get memory within that same SRAD's 28 GB's of memory for faster access. Likewise, for Processes started on the second POWER = SRAD1 and its 2.5 GB.
Can we determine which POWER CEC drawer or which processors?
- No, we can't these are all logical and relative to the VM - i.e. every VM reports REF1 numbers starting from zero and SRAD numbers starting from zero.
- In fact, that would cut across the whole logical resource allocation of the Power range - we don't allocate physical resources (that would be dumb and like some other vendors :-) the machine and specifically the Hypervisor determines the actual resources and has an option to change then if needed like more memory or CPU being added via Capacity Upgrade on Demand or in the unlikely event of a failure.
mpstat -d 1 99999
- Follow this link to the manual page for the mpstat command
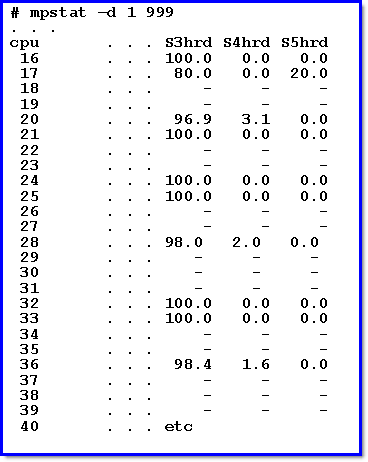
This gives you the dynamic picture of how often the CPU/cores are accessing Local, Near and Far memory at the moment. Below is a sample of the output but I have removed 15 columns of output to focus on Affinity.

So let me explain what we have here:
- We have a line for every logical CPU/core
- The S3hrd column means the percentage of Local thread dispatches on this logical processor.
- The S4hrd column means the percentage of Near thread dispatches on this logical processor.
- The S5hrd column means the percentage of Far thread dispatches on this logical processor.
- The "-" means the SMT is not being used at the moment and we can see the POWER intelligent SMT use in action.
Yes, those column headings are as clear as mud! But it shows out the majority of memory access is Local with some (20%) Far access from CPU/core 17 and a few lower percentages to Near memory in the other CPU/cores. Of course, the very high bandwidth between POWER chips and between nodes (in the hundreds of GB/s) means Near and Far memory references are not a problem provided they are not the majority of memory accesses.
topas -M
- Follow this link to the manual page for the topas command
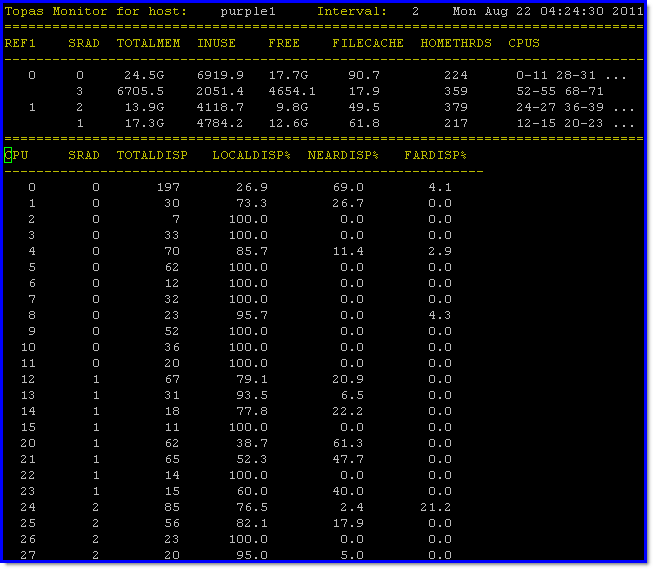
If you have lots of CPU/core in a Virtual Machine and four times that (due to SMT=4) logical CPUs you are going to go nuts watching the data steam of the top of the screen. So here good old topas command to the rescue and actually shows the lssrad, mpstat like data and more on a screen. Either start this with: topas -M - or - start topas and hit capital M to switch modes.

So let me explain what we have here (note: there are 60 other logical CPUs removed from the above screen capture):
- Top half we have:
- lssrad like data and more
- REF1, SRAD, TOTALMEM and CPUs are as the lssrad command but note the TOTALMEM columns are MB or if there is a G at the end in GBs.
- New information of the memory INUSE (being used) or FREE (unused) the Percentage used for FILECACHE (file system cache) and the number of threads at HOME on this SRAD.
- This is some interesting stats that I have not seen anywhere else - except the programmers API for the perfstat library.
- We can see where the file system cache is placed as all regular disk I/O goes through this shared memory kernel structure and the numbers of threads allocated to SRADs - there is not much we can do about either of them but it is good to know and not seen before.
- Lower half we have:
- The logical CPU number and the SRAD it is in
- Then the TOTALDISP meaning the number of processes dispatched on this processor (i.e. running)
- Then the dispatches that are Local, Near and Far.
- But Local, Near and Far are used in a very different way here - this is from the process perspective not the memory access perspective.
- Meaning these are percentages of processes being run relative to their "Home" SRAD.
- Example CPU 0 has 197 processes being run in this 2 second interval and 26.9% are local - so CPU 0 is there Home SRAD = good, unfortunately, 69% are not at Home but from a POWER processor that is Near - these will have brought there memory cache lines with them but further memory accesses are slightly slower. Then 4.1% on my Power 770 are from the other CPU CEC drawer and have longer memory paths.
- The other CPUs are much better at using CPU time on Home SRAD processors.
Also you can just see that on this Virtual Machine has been deliberately spread across many SRAD's in an uneven way in both memory and CPU terms to cause Far memory accesses. Here is the lssrad output to show it is a bit of a mess:

But that is another story for another blog in this series!
Additional Information
Other places to find Nigel Griffiths IBM (retired)
Document Location
Worldwide
[{"Business Unit":{"code":"BU058","label":"IBM Infrastructure w\/TPS"},"Product":{"code":"SWG10","label":"AIX"},"Component":"","Platform":[{"code":"PF002","label":"AIX"}],"Version":"All Versions","Edition":"","Line of Business":{"code":"LOB08","label":"Cognitive Systems"}},{"Business Unit":{"code":"BU054","label":"Systems w\/TPS"},"Product":{"code":"HW1W1","label":"Power -\u003EPowerLinux"},"Component":"","Platform":[{"code":"PF016","label":"Linux"}],"Version":"All Versions","Edition":"","Line of Business":{"code":"","label":""}},{"Business Unit":{"code":"BU058","label":"IBM Infrastructure w\/TPS"},"Product":{"code":"SWG60","label":"IBM i"},"Component":"","Platform":[{"code":"PF012","label":"IBM i"}],"Version":"All Versions","Edition":"","Line of Business":{"code":"LOB57","label":"Power"}}]
Was this topic helpful?
Document Information
Modified date:
13 June 2023
UID
ibm11126041
