Technical Blog Post
Abstract
What's new for January 2017
Body
Enhancements to Geo-Analytics reports
You can now add calculated metrics to your geo-analytic reports. These new calculated metrics provide instant insights into your conversion, abandonment, and other calculated metrics relevant to the location of your customers.
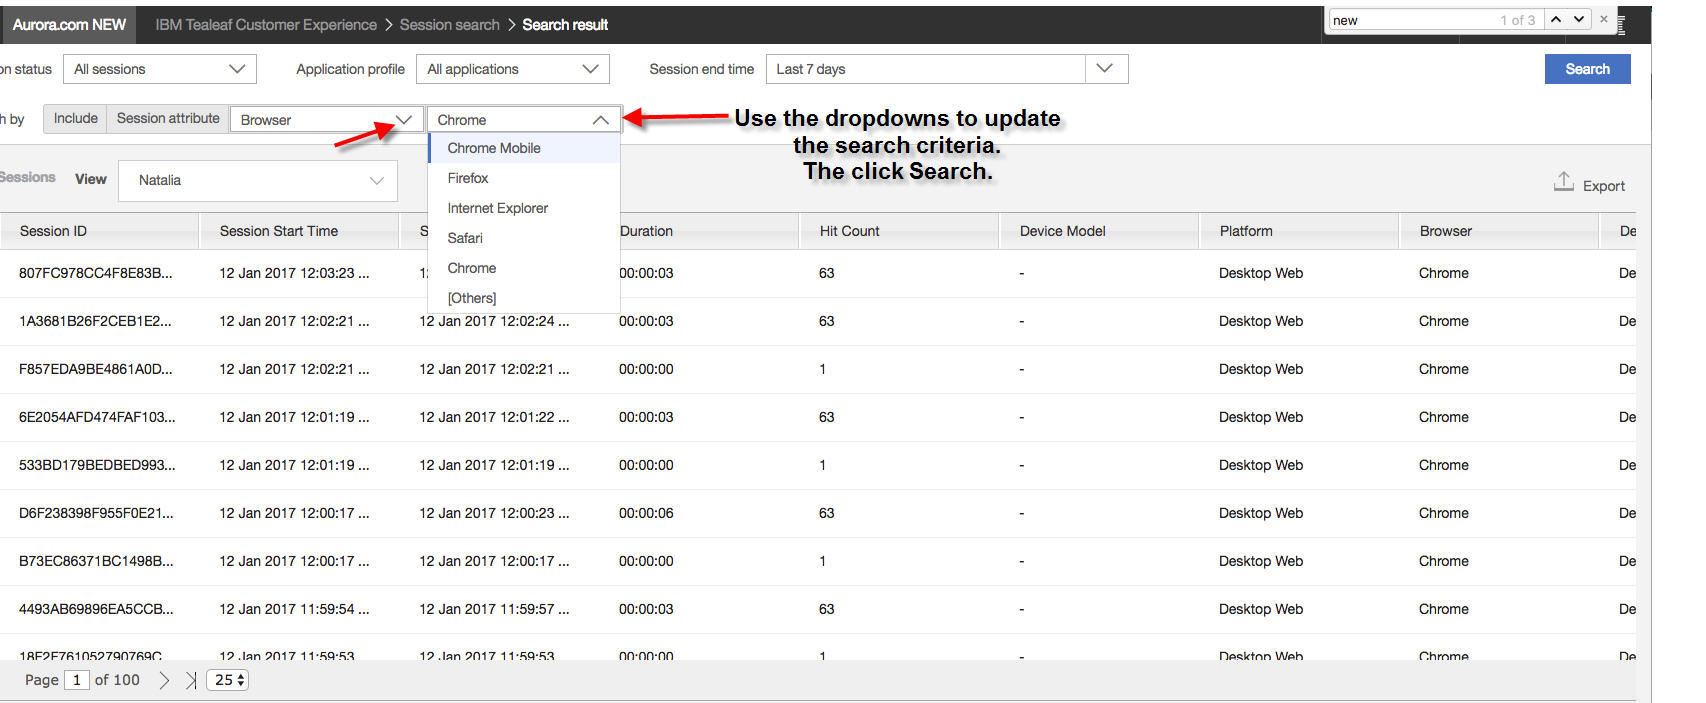
Searching for sessions made easier
You searched for a session, but now, you want to change the criteria to improve the search results. Now you can easily edit the search criteria and search again.
 |
Struggle scores can be added to a session list
You can now leverage your struggle analytics data in other areas of TL SaaS. You can add your session struggle score to a session list as part of a session list template.
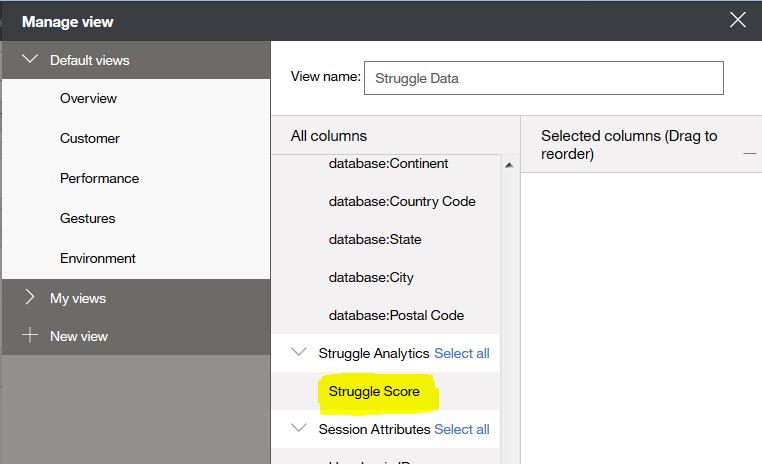 |
In addition, you can search for sessions based on the struggle score.
|
|

What area of the page are your users spending the most time?
You can now use the Attention Map overlay to figure that out. The Avg Fold line has been added!
The Avg Fold line helps you identify the area on the page of most interest to the user and where to place information that you want the user to access quickly.
The Avg Fold line is the average viewing height of the page area that all users and all sessions can see without scrolling. The area above the fold line is the area that most of the users viewed in their sessions.
|
|
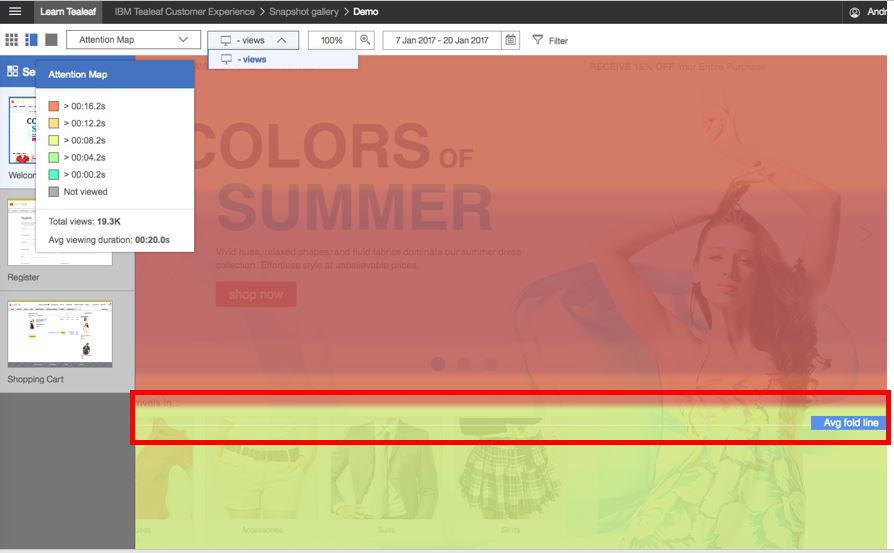
Color definitions show view times in Attention maps!
You can now see view times in the Attention Map. The color definitions now show the view time for the areas of the page. The time is shown in seconds. The times are calculated as a percentage of the Average viewing duration.
 |
Display your snapshots and overlays so they look like desktop, tablet or a mobile
You can now display snapshots with overlays as a desktop, tablet or mobile. The total views for each device type is shown.
|
|

Need more information on these features?
Check out the January 2017 release enablement video.
UID
ibm11122495