Technical Blog Post
Abstract
Hidden Gems - Red Alert, Red Alert!
Body
Let me kick off this week's Hidden Gems with a little number from Basement Jaxx…
Red alert! Red alert!
It's a catastrophe
But don't worry.....Don't panic
That's right, we're talking about Alerts this week, where to find them, what to set and who to send them to. Alerts are an oft-neglected feature in IBM Digital Analytics which can help to save your bacon when things go wrong on your website.
The inspiration for this blog came from a couple of customers that I've been working with who accidentally knocked off some of their tags during a code release. It was several days before the problem was noticed which meant it was too late to perform a rollback and they had to wait for their next code release to fix the issues. In one case it was the Shop Action 5 tag that was knocked off which was critical to their abandoned cart email program. Incidents like this can have a very real impact on a business with significant revenue loss.
Let's start with where to find your Alerts in DA. On the menu go to, Manage > Distribution > Alerts. There are a total of 50 alerts available to use so you should consider not only using them to tell you when things go wrong, but also when things are going right such as exceeding sales targets. Go ahead and click the Create Alert button.
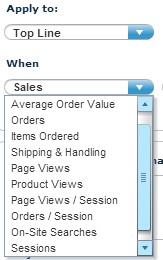
Under "Apply To" you can select from either Top Line metrics, or drill down to individual products or referring sites. For the purposes of demonstration we'll stick to the Top Line options today.
I'm going to start off with our good news alert, we're smashing our sales! Set the condition to "Is Greater Than" and in the value I'm going to set 150 to represent a percentage.
The last field, "Compared To" is where you can do some cool stuff to decide what you're benchmarking your sales on. If you have low weekend sales it wouldn't make sense to select a 7 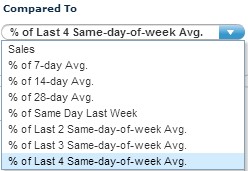 day average because lower sales on the weekend will constantly trigger your alerts. In this case you'll want to compare to the same day of the week in the prior 1, 2, 3 or 4 weeks.
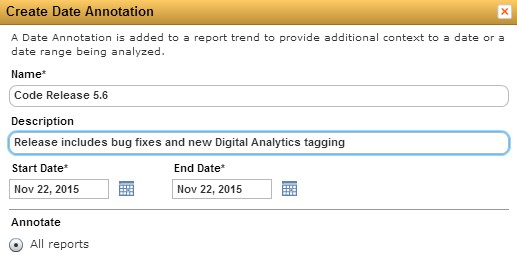
Now that you've added your alerts let's think about what usually causes alerts to be triggers. Common ones are code releases, new campaigns, SEO enhancements and new referral sources to name but a few. Any of these aspects which are within your control can be added to your Top Line Metrics reports with Date Annotations. This gives you a very quick visual cue to let you know if the date that those events occurred correlates with significant movement in your KPIs.
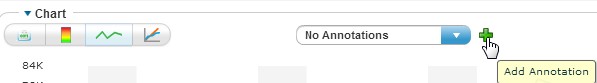
Date Annotations are found under Manage > Report Options > Date Annotations, or from the Top Line Metrics by clicking the green plus icon.
Once you've created the annotation you'll need to select All Annotations or My Annotations to display it on your chart.

This will be my last blog of the year so I'll take the opportunity to wish you a happy holiday and all the best for 2016. See you next year for some more Hidden Gems!
Thanks,
Aidan.
Further reading…
-IBM Digital Analytics Team
Curious about other presentations we've done?Click here and check under Connect With The Experts: Support Technical Exchange (STE) Replays
If you haven't visited the IBM Digital Analytics blog before, click here:IBM Digital Analytics Blog, then bookmark
If you're interested in getting a demo of IBM Digital Analytics click here:About IBM Digital Analytics
UID
ibm11122291