Technical Blog Post
Abstract
Hidden Gems – Smash Your Targets!
Body
 Welcome to the second in the series of Hidden Gems where we delve into some of those often neglected aspects of IBM Digital Analytics. This week I'll be giving you a rundown of how to use Forecast Metrics to visualise how your KPIs are performing against your targets.
Now some of you will already have established targets for your KPIs but if you don't now is the time to jump across to one of my favourite analytics gurus, Avinash Kaushik, and have a read of this blog where he discusses identifying targets on step 4.
Ok, got those targets ready to hand? Lets go!
 The first step is to switch the application selector from Digital Analytics over to Import. Once you're in Import resist the urge to click straight into Forecast Metrics and instead slide on down to Manage > Import Configuration.
In the list of available forecast metrics I'm going to select two to keep this example short and sweet. They are Sales and Bounce rate. You'll notice that Date ID is in there already. This allows you to have daily changes in your targets to account for campaign planning, seasonal trends, flash sales, weekends and any other factors that you want to take into account. Go ahead and click Save.

Now that itchy trigger finger can go back to the menu and choose Import > Forecast Metrics. From here click on "Download Template File" which will contain the fields that we just configured.
 It comes down as a CSV and will most likely open in Excel by default for you. As you can see in this example we only have one date. For those Excel wizards out there it won't be much of an issue to autopopulate the date in Excel, but if you're like me and you need to lookup these things from time to time here is a quick 5 step guide to auto populate the date. Don't forget this template is a CSV file so you'll either need to auto populate a date column in a separate Excel sheet and copy it over or temporarily change the template file to an Excel format so you can use the date format and autofill features.
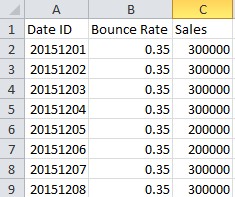 Now that you have your date column sorted lets go ahead and enter our daily targets. My bounce rate target is going to stay a consistent 35% throughout the year and I'll have a midweek sales target of 300,000 and a weekend target of 200,000. Once that's finished go ahead and save the file (remember CSV format if you changed it earlier!) and then back on our Forecast Metrics screen click Browse to select our file and then click the Process Import File button.
It usually takes around 30 minutes to validate the data, depending on the size of the file. The data is loaded immediately after validation. Loading should take less than five minutes, and the data is available for reporting as soon as it has finished loading.
Now all you have to do is jump back into Digital Analytics and open your Top Line Metrics report.

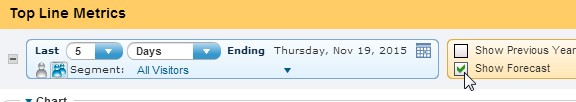
Click on the down arrow next to the Sales metrics and select Trend. In the Trend view you'll see a checkbox for Show Forecast. Check that and hey presto! You now have an immediate view on to the Good, the Bad and the Ugly. Replicate the Good, learn from the Bad and stop the Ugly straight away!
Thanks,
Aidan
Further reading…
-IBM Digital Analytics Team
Curious about other presentations we've done?Click here and check under Connect With The Experts: Support Technical Exchange (STE) Replays
If you haven't visited the IBM Digital Analytics blog before, click here:IBM Digital Analytics Blog, then bookmark
If you're interested in getting a demo of IBM Digital Analytics click here:About IBM Digital Analytics
UID
ibm11122249