As Mr nmon I was recently asked about a nmon feature for which the answer was: "You should use the nmon External Data Collectors feature." Only to be told "Eh!" When I went looking there is a mention of the feature in the nmon Manual pages for AIX 7.2 but I could not find the old the full explanation on the Internet. Eventually, I found it hidden away on a wiki which was used for testing during a DeveloperWorks update - it was a lucky find before it was scrapped. So I am reproducing it here.
A common requirement is for some new stats to be added. This falls in to two classes:
- Some are useful for everyone and I will do my best to add the feature with nmon for Linux. For nmon for AIX it might take a longtime and a new AIX release. External Data Collectors can be used to proto-type the collection into the nmon output file and then graphed.
- Other new stats are specific to the user or even just one server. In this case, the user can add a External Data Collector for there specific need.
So you want some extra data collected. We a assume:
- You have found the stats is a file from the OS like in Linux the /proc filesystem
- or -
- You have a command that outputs the stats
- and you can write a script that can extract the stats and format them ready for nmon.
When nmon starts it check if you have set some shell variables set and acts on them.
- NMON_START - this should be a command or script that is run before nmon collects date. At the very least it should output to a separate data file the Heading line for the new stats in nmon format - see examples below. This could be used to setup some more complicated data extraction mechanism or service. Optional but normally a good idea.
- NMON_SNAP - this should be a command or script that is run by nmon for each snapshot of data collected. It will pass this command or script the Timestamp (T0001, T0002 etc.) so we can see how to match the nmon saved data. Mandatory.
- NMON_END - this should be a command or script that is run after nmon collects date. Normally, you can forget this shell variable but some complicated data might need sorting out and reformatting so you have an opportunity to get the formatting done at the end. Optional and rare
- NMON_ONE_IN - some data collect can take a long time and longer than the time between snapshots. For example the data takes 10 seconds to get but you ask nmon to collect data every 2 seconds. Obvious this will not work. If you set:
export NMON_ONE_IN=10
Then the command or script is only run every 10th snapshot = 20 seconds. Optional and rare
- TIMESTAMP=1 - this ask nmon to not run the NMON_SNAP command or script with the Timestamp number (T0001, T0002, etc) but hands it the time and date = hours, minute, seconds and day, month, year. This means you can't merge that data with the nmon file but you do have the full time and date in the file. Optional and rare
Simple Worked Example - the Number of Processes Count
Script: ps_start
echo "PROCCOUNT,Process Count, Procs" >/home/nag/ps.csv
Notes:
- Output and create the file ps.csv - as it is a "comma separated values" file.
- The line contains
- Data name "PROCCOUNT" this appears in the Tabs of the nmon Analyser
- The Description "Process Count" - Never ever start this with a "T" or it gets confused with a T in the timestamps (T0001 etc.).
- The stats name "Procs"- in this case only only but it could be lots of comma separated values
Script: ps_snap
/bin/echo -e "PROCCOUNT,$1,\c" >>/home/nag/ps.csv ps -ef | wc -l >>/home/nag/ps.csv
Notes:
- The >> means append to the end of the file
- It outputs the Data name then the $1 is the T000# snapshot timestamp that is passed to the command or script by nmon.
- The second line gets the data and adds that to the end of the line.
- The echo -e and \c are to stop the newline character normally added to the echo output. Also the /bin/echo ensures it is the echo command and not the shell script built-in. This was for Linux - I think its slightly different on AIX.
Setup the environment variables
export NMON_START="/home/nag/ps_start" export NMON_SNAP="/home/nag/ps_snap"
Notes: I like the full path names - it avoids complications if you happen to be in a different directory. nmon will search your path for the command or script but lets not waste CPU cycles.
Collecting the data
Now run nmon as you would normally for saving the data to a file. This does NOT work if you are using nmon online to screen - which is good and you don't want to muck up you background data collection.
The new data collected
$ cat ps .csv PROCCOUNT,Process Count, Procs PROCCOUNT,T0001,243 PROCCOUNT,T0002,243 PROCCOUNT,T0003,242 PROCCOUNT,T0004,242 PROCCOUNT,T0005,241 PROCCOUNT,T0006,241 PROCCOUNT,T0007,240 PROCCOUNT,T0008,240 PROCCOUNT,T0009,239 PROCCOUNT,T0010,241 PROCCOUNT,T0011,241 PROCCOUNT,T0012,242 PROCCOUNT,T0013,243 PROCCOUNT,T0014,242 PROCCOUNT,T0015,243 PROCCOUNT,T0016,244 PROCCOUNT,T0017,245 PROCCOUNT,T0018,246 PROCCOUNT,T0019,247 . . .
and we have a nmon output file: vm26_160701_1641.nmon with 100 snapshots of data in it.
Merge the data
It is not hard just append it to the end of the nmon file either:
cat ps.csv >>vm26_160701_1641.nmon or cat vm26_160701_1641.nmon ps.csv >vm26_160701_1641_merged.nmon
Graphing it with nmon Analyser - its automatic
If we use the nmon Analyser it fines the new data lines PROCCOUNT and automatically graphs the numbers.
Hint:
If you are collecting many similar numbers like say percentages then the graphs will work well. If however, you have on/off values like 0 and 1 plus percentages plus counts in the thousand or millions then the graphs are scaled for the larger numbers and you will never see on/off or percentage on the graph. So collect the type of number separately in different Data Names (here PROCCOUNT).
Here is the graph from the Analyser:
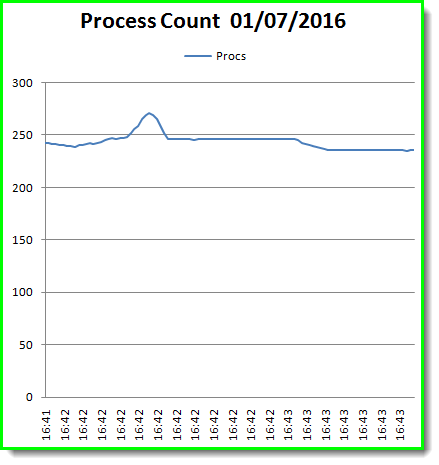
It is a little boring as Linux for some reason now has 220 processes even if its a single user with no graphics!
IMHO quite system admin hostile and only 10 processes so far and any CPU time in the ps -e output.
The analyser also created a min, max, average and weighted average graph.
Graphing it with nmonchart
This involved adding 6 lines of script plus adding buttons and checking if the data is in the file - all by cut'n'pasting the lines for another sort of data in fixed columns. This took me about 2 minutes of Korn shell scripting time.
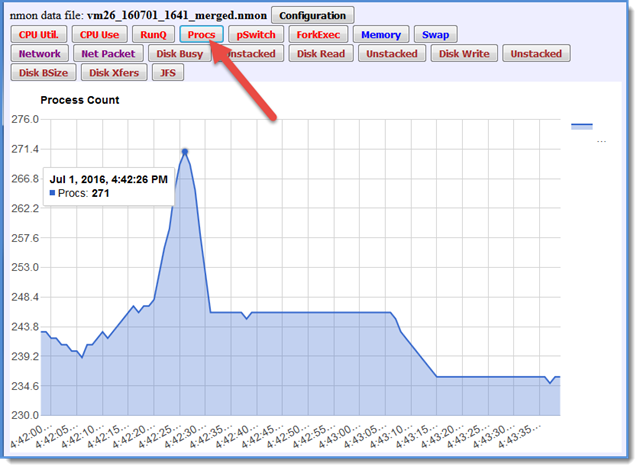
Well done Google Chart is adjusted the left data offset to make the graph more interesting and useful.
Oracle Transaction Counters External Data Collectors Example
Here is another example collecting transaction commits and rollback statistics from the Oracle database using two scripts called oraclestart and oraclesnap that run an SQL statement and save the data in a file called dbstats.csv:
oraclestart
echo "DATABASE,Transactions,commit,rollback" >dbstats.csv
oraclesnap
export ORACLE_SID=MYDATABASE ( sqlplus -s "system/manager as sysdba" <<EOF set heading off set headsep off set echo off set lines 2000 set feedback off set newpage none set recsep off select 'DATABASE,$1,'|| sum(decode(name, 'user commits', value, 0))||','|| sum(decode(name, 'user rollbacks', value, 0)) from sys.v_$sysstat; EOF ) >> dbstats.csv
Setting up the shell variables
export TIMESTAMP=0 export NMON_START="oraclestart" export NMON_SNAP="oraclesnap" unset NMON_END unset NMON_ONE_IN
Now run nmon
You need to ensure the ORACLE_SID and usernames and password work in your environment. Do this by running the command manually with: * oraclesnap T9999
And checking the results in the file dbstats.csv
This should put one line in the file dbstats.csv. This script has to log on to the Oracle database each time it runs, so you should not be doing this every second as it will take elapsed time and CPU resources. But if you are collecting nmon data once a minute or more this overhead should be small.
Thanks to Ralf Schmidt-Dannert of the IBM SAP and Oracle Solutions team in Minneapolis, USA for this example.
