How To
Summary
AIX by default captures performance stats for the last week - even if you didn't ask it to do that.
Objective

AIX by default captures performance stats for the last week - but you need to know where to look and how to graph them.
So there is "before and after "comparisons that can be made to highlight the change causing issues and likely causes.
Environment
AIX on a Power System - installed in the last 10 years!
Steps
Well, you might not know but AIX is auto
Now the bad news - it is using topasrec and recording it as raw binary data.
Now the good news you can use topasout -a recording-file to generate "nmon data"
Now the bad news it is not really nmon data and none of the regular downstream tools can graph it.
Now the good news - I butchered nmonchart to work with this topasrec / topasout data and its called topaschart
You can find the topaschart tool for downloading (it is a Korn shell script) and instructions here:
Example output:
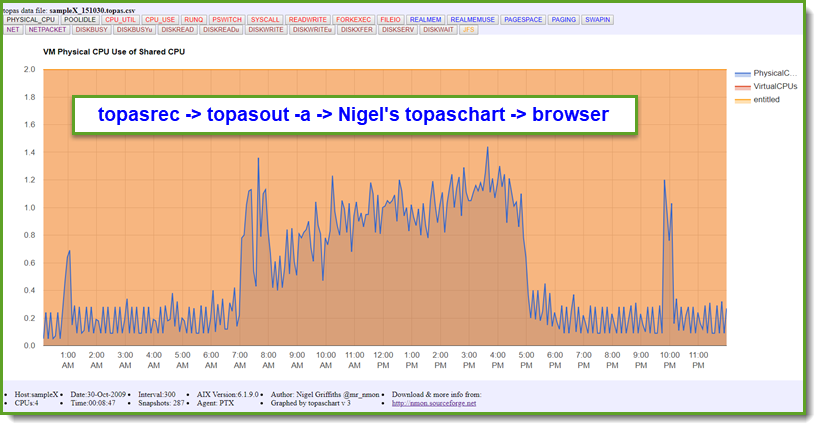
Yes, that is the same website as nmonchart (on which topaschart was based) - perhaps you could briefly have a look at the rest of my tools like the new one njmon :-)
If you use topaschart - please let me know and any extra charts you really need and I will see what I can do, Cheers, Nigel
Additional Information
Other places to find content from Nigel Griffiths IBM (retired)
Document Location
Worldwide
Was this topic helpful?
Document Information
Modified date:
09 June 2023
UID
ibm11114065