Troubleshooting
Problem
Stop Guardium Filling up and improve performance - Correlation Alerts to detect spikes in data stored in the Internal tables within 2 hours
A method to identify quickly when a spike in the amount of data being stored in the Internal Guardium table(s) occurs.
This is an example of how Guardium Administrators can implement an alert on data spikes.
These reports and alerts will show when there is any large spike in data for certain tables in the Guardium Appliance.
These reports and alerts will show when there is any large spike in data for certain tables in the Guardium Appliance.
This can help Administrators to further investigate what is causing the spikes in order to remediate the situation quickly
- before the Appliance fills up.
- helping performance of audit processes etc
The investigation would involve using other GUI reports to drill into the data during the spike period to identify the cause of the spike.
This can lead to quick Policy changes to avoid Appliances filling up and also aid in the performance of audit processes and the system as a whole.
The below tables are examples that may fill rapidly even within a 1 day period!
GDM_SESSION GDM_CONSTRUCT_TEXT
The following alerts are available at this time for the above 2 tables
--IBM Session spike alert
--IBM FULL SQL spike alert
The alerts will trigger a message in syslog and/or email alerting of a recent spike in data on specific Internal Guardium tables in the last 2 hours.
Implementation:
Upload and Import the alerts via the Definitions Import
Upload and Import the alerts via the Definitions Import
The alerts also make reference to the following reports which are also uploaded as part of the alert.
1) Use Query report Builder to find and display the reports on a Guardium Appliance where you wish to implement it
Reports > Report Configuration Tools > Query-Report Builder
Access Domain
Reports > Report Configuration Tools > Query-Report Builder
Access Domain
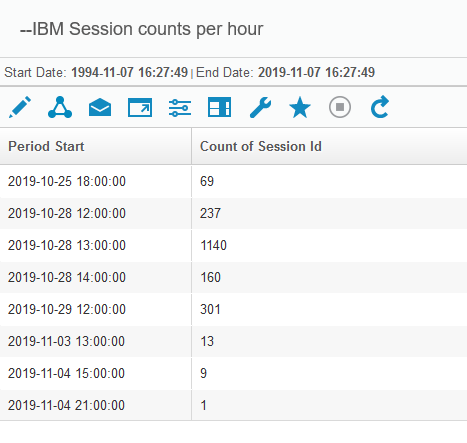
--IBM Session counts per hour
--IBM FULL SQL counts per hour
--IBM FULL SQL counts per hour
The reports show Access Period (1 hour intervals ) and the counts of data that were recorded during that period (hour).
Adjust the parameters to view data over the last hours or days to get a feel for the correct threshold to use in the alert builder.
Decide on an acceptable threshold (count) number above which you would like to get alerted on for each of the reports.
Decide on an acceptable threshold (count) number above which you would like to get alerted on for each of the reports.
The example report below contains dummy figures - the counts in the right hand column will give an idea of values during normal use
2) Amend the alert via the Alert Builder and set the following accordingly
- Threshold (ie the "count" or "spike") above which you wish to be alerted on
- This should be changed from the default setting per your decision in 1) above.
- add an email address for the receiver
- add an email address for the receiver

3) Check that the Anomaly detection has the new alerts listed at the end of the list
Setup > Tools and Views > Anomaly Detection
Setup > Tools and Views > Anomaly Detection
At this point if the Threshhold is ever breached you should receive an alert within the hour allowing you to investigate and rectify before the problem escalates.
* IMPORTANT * 
If implementing the Alert on more than one Appliance consideration needs to be given to the Threshold value for each Appliance. It is recommended to use these alerts on a select number of Appliances - or just one - where there may have been DB Full or audit performance issues.
The Central Manager (redacted red hostname) can control which Appliances the alert is relevant for by specifying it in the Alert Builder definition.
The example below shows the Alert is to be used for just one single Collector (redacted blue hostname) and is active for that Collector only
NOTE
If another Appliance needs the alert with a different Threshold number then a new alert needs to be created for each Appliance using its own Threshold number
Further Considerations
The Threshold may need a series of adjustments - especially initially - so that an alert is sent only occasionally when a true "spike" of data occurs
The above is an example of what can be achieved. Other similar alerts could be configured for other tables that may get full.
The Unit Utilization reports may be a useful source for the counts per period in this case - eg.
Exceptions
Violations
etc
The Unit Utilization reports may be a useful source for the counts per period in this case - eg.
Exceptions
Violations
etc
Document Location
Worldwide
[{"Business Unit":{"code":"BU059","label":"IBM Software w\/o TPS"},"Product":{"code":"SSMPHH","label":"IBM Security Guardium"},"Component":"","Platform":[{"code":"PF016","label":"Linux"}],"Version":"All Versions","Edition":"","Line of Business":{"code":"LOB24","label":"Security Software"}}]
Was this topic helpful?
Document Information
Modified date:
28 January 2020
UID
ibm11104339