Technical Blog Post
Abstract
ITCAM4Tx Tracking : WRT in Agent-Based versus AgentLess
Body
1. The two ways to integrate the RT WRT agent with Tx Tracking agents are :
Agent-based and AgentLess.
- "Agent-based" : This is enabled by selecting the "Enable Transactions Tracking Integration"
option during WRT agent configuration.
It will cause the WRT (t5) agent to send TTAPI events to a designated Tx Collector (tu) agent.
This option populates the regular Servers, Components, Applications, Transactions (SCAT)
workspaces in TEP.
- "AgentLess" : This is enabled by selecting the option "Monitor All TCP Traffic" during WRT agent
configuration. It will cause the WRT (t5) agent to fill its 'T5TCPSTAT' attribute group workspaces.
The Tx Reporter (to) agent will then need to be configured to read this data, using its
"Aggregation Agent List" ; but by default it is configured to read all tu and t5 agents.
This option populates the "Agentless Data" workspace only in TEP, the WRT (SCAT) workspaces
in TEP will all be empty. You can turn none, either or both on.
Remark : "Enable transaction tracking integration" option is part of the agent based tracking.
Thus it is only available in WRT agent configuration when HTTP/HTTPS monitoring option is
selected. So having it disabled when HTTP(S) tracking is not enabled is by design.
#######
2. Useful documentation about AgentLess and agent-based WRT configuration
You can refer to articles available in IBM Knowledge Centre
Agent-based WRT :
http://www-01.ibm.com/support/knowledgecenter/SS5MD2_7.4.0/com.ibm.itcamt.doc_7.4.0.0
/rt/Install_Guide/wrt_config_win.html?lang=en
AgentLess WRT :
http://www-01.ibm.com/support/knowledgecenter/SS5MD2_7.4.0/com.ibm.itcamt.doc_7.4.0.0
/tt/dita/concept/kto_ws_transrep_agentless.html?cp=SS5MD2_7.4.0%2F8-4-1&lang=en
Tx Reporter agent configuration parameters:
http://www-01.ibm.com/support/knowledgecenter/SS5MD2_7.4.0/com.ibm.itcamt.doc_7.4.0.0
/tt/dita/reference/kto_tools_datacoll_rep.html?lang=en
#########
3. Example of configuration of WRT in AgentLess mode
Here below, WRT and Tx Reporter agents are installed on the same (Windows OS) system in this example.
see kincinfo -t command results:

it shows here that WRT (t5) version 7.4.0.0 and Tx Reporter (to) version 7.4.0.1 (7.4 + IF1) are installed on a
Windows system.
3.1 WRT is configured in AgentLess mode as seen in the 2 following screen captures :

The 'Monitor All TCP traffic' option is selected/ needed for Agentless mode.
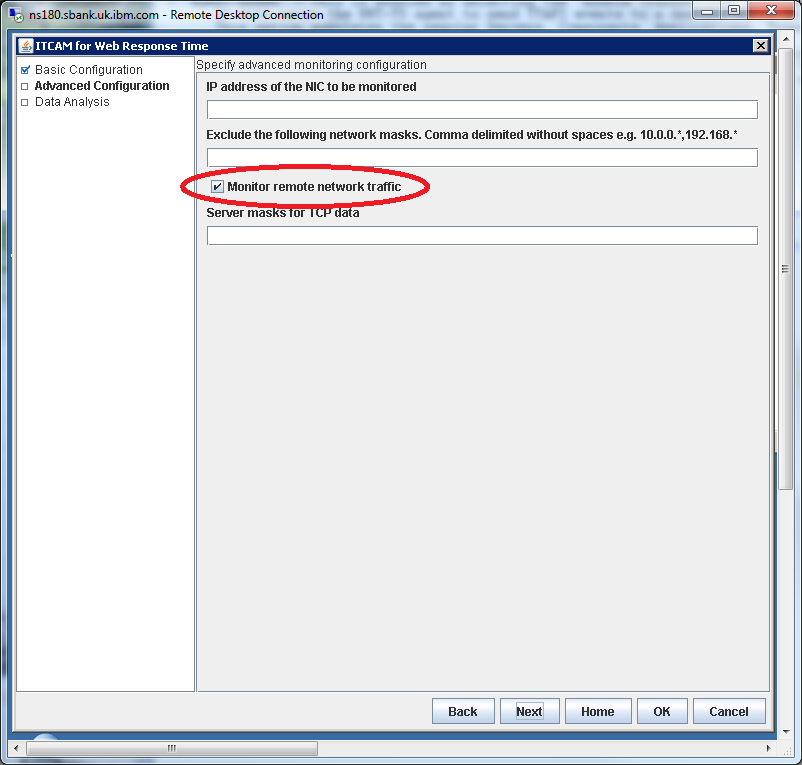
The 'Monitor remote network traffic' option is selected/needed for Agentless mode
3.2 Tx Reporter configuration :
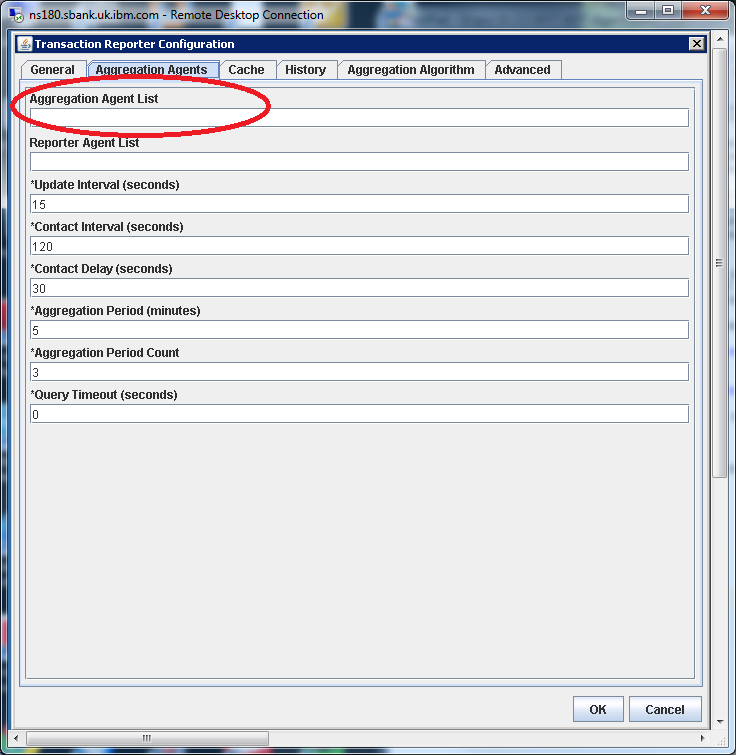
You can leave the 'Aggregation Agent List' field blank. The Reporter will then collect data from all
available Aggregation (t5, tu) agents.
##########
4. Example of TEP workspace results with WRT in AgentLess mode
4.1 WRT Configuration "Agent details" in TEP

in TEP, WRT agent details workspace info should match what you have setup during configuration of the
WRT agent.
4.2 WRT 'Network' example of results in TEP - Web Response Time workspace results example :
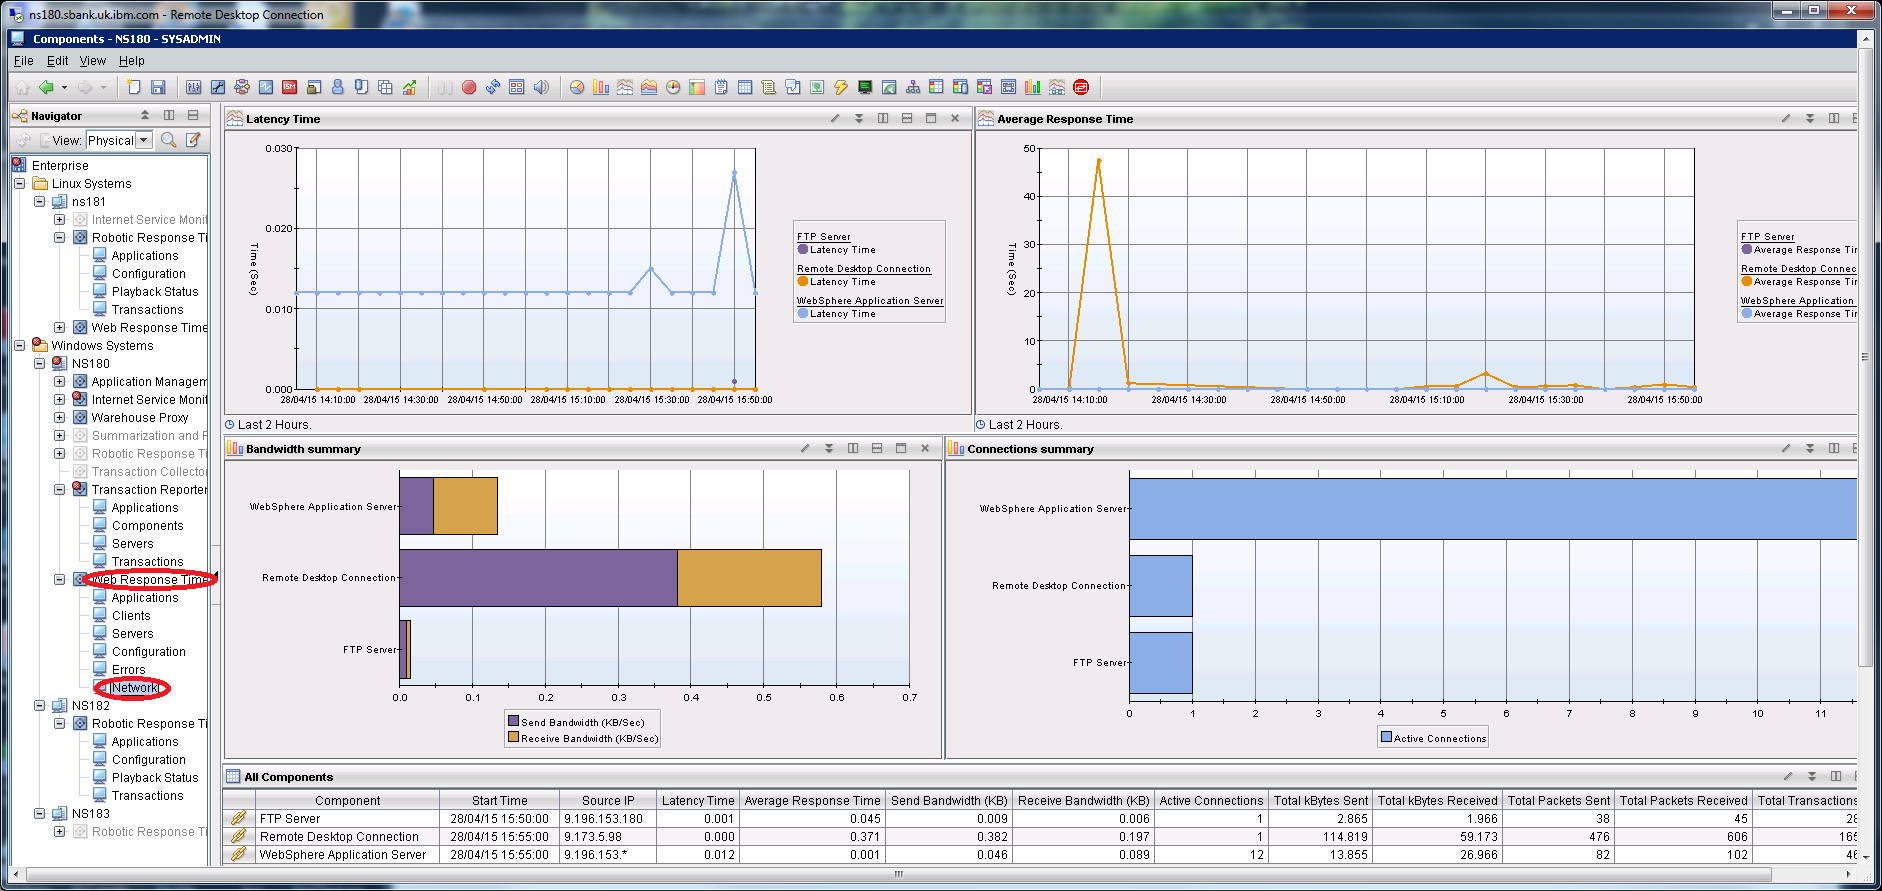
WRT 'Network' workspace should contain data. Latency Time and Average Response Time views will also
report data, provided you have enabled History Collection configuration for T5TCPSTAT attribute group,
as seen further below.
4.3 WRT History Collection Configuration for T5TCPSTAT attribute group
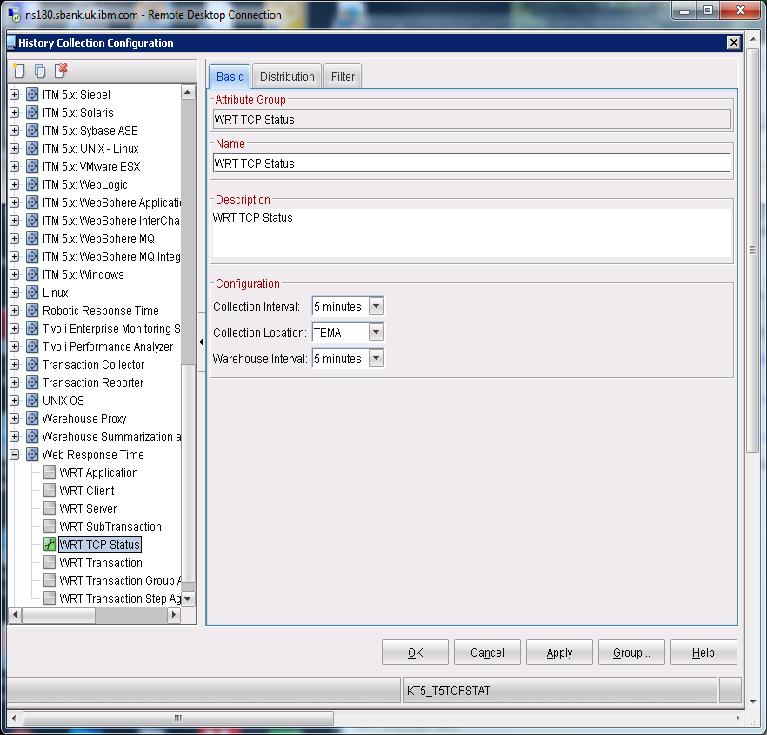
WRT T5TCPSTAT attribute group Basic setting example

WRT T5TCPSTAT attribute group Distribution setting example; collection is distributed on WRT node
NS180:T5 here, where WRT agent is installed and running.
4.4 TEP Transaction Reporter : various workspace views
If all is configured and work properly, you should see this kind of results in TEP
Tx Reporter Status view:
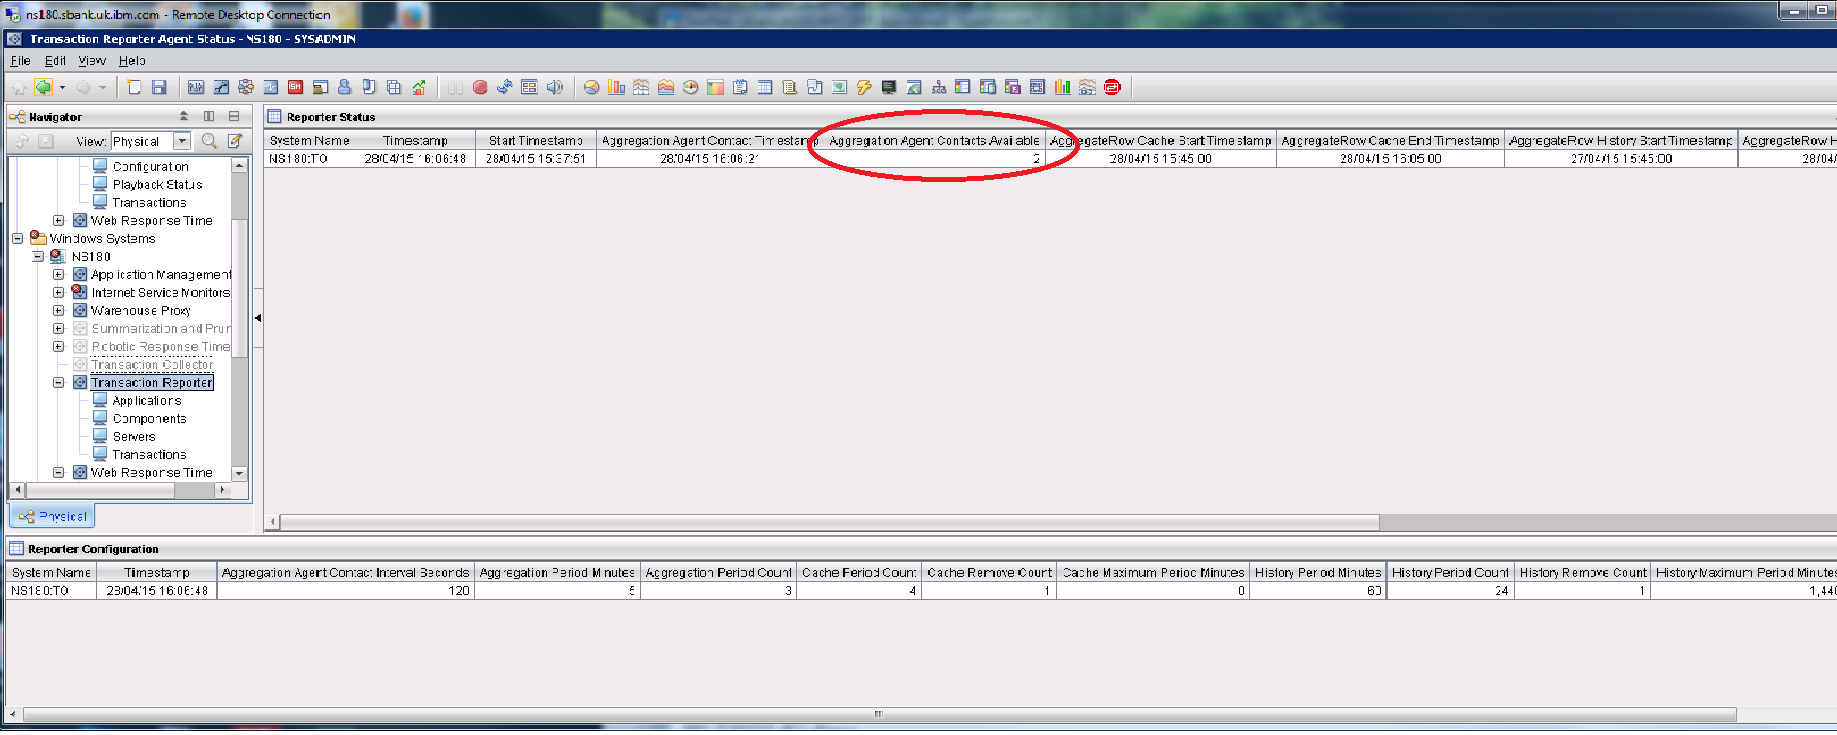
If If you have for instance 2 WRT agents configured in agentless mode and installed in your environment,
the field 'aggregation Agent contacts available' field of Reporter Status view should report the right number
of agentless agents.
In my test environment, I had 2 WRT agent in agentless, hence the value of "2" in 'aggregation Agent
contacts available' column.
Tx Reporter Diagnostics view:
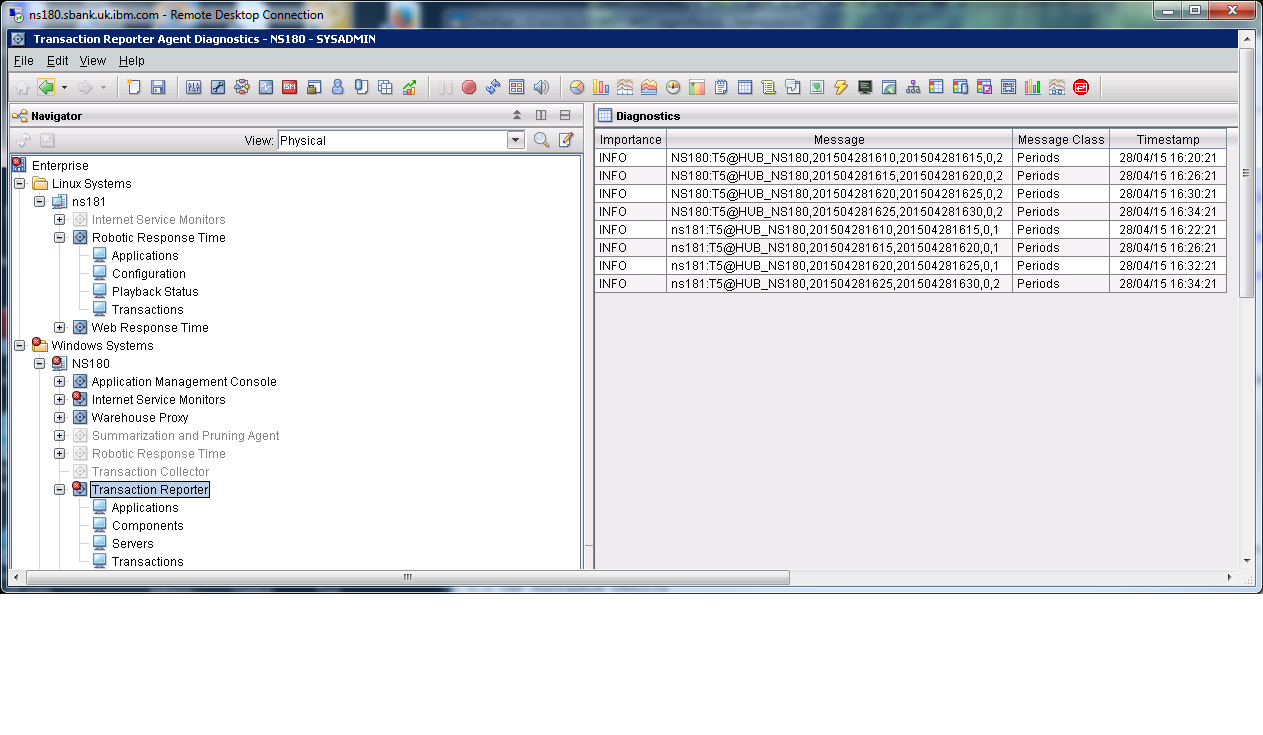
Tx Reporter -> Workspace -> 'Tx Reporter Agent Diagnostics' should display as seen above messages
showing evidence of data being collected by the Tx reporter agent from its aggregation agents.
Tx Reporter Overview view:

Tx Reporter -> Workspace -> 'Transactions overview' should report data in the Server Component Topology view
Tx Reporter AgentLessData view:

Tx Reporter -> Workspace -> Agentless Data should report data in Network Topology view
UID
ibm11083351