How To
Summary
nextract pulls statistics from the Power Systems HMC by using the HMC Performance and Capacity Monitoring REST API in to three useful formats or graphs. This is called "nextract plus" as it extracts performance statistics, energy statistics (Temperature and Watts) and Shared Storage Pools (SSP) statistics.
This nextract tool is not an IBM product, so there is no IBM support.
It is the personal project of the author.
All of the program Python source code and sample data is available in the download file.
Objective

Environment
- Extracts data from the Hardware Management Console (HMC) REST API and is written in Python 3.
You must have a recent version of Python available. Python 2.x is not supported at all. - This version gets every available Performance Statistics for Power Servers, Virtual I/O Server, Hypervisor, Logical Partition (virtual machine) and writes it to an InfluxDB for graphing with Grafana (or other tools).
- Included in this version are the Python programs for Power Systems energy (electrical Watts and Temperatures) and Shared Storage Pools (SSP).
- The matching Grafana dashboard for the performance statistics offers 70+ performance graphs many covering multiple statistics, 24 information single statistic, or configuration detail panels.
- The statistic data can be saved to a
- Saved to a comma-separated values file (CSV)
- Used to generated Google chart webpages of graphs
- More importantly save the data to the InfluxDB time-series database for graphing by Grafana.
This later option is the recommended use as it allows long-term data collection of the statistics and flexible user graphing.
- Many bug fixes, code refactoring, and enhancements.
- The Python programs are:
- nextract_plus.py for the Performance statistics.
- nextract_energy.py for the Watts and temperatures.
- nextract_ssp.py for the Shard Storage Pool (SSP).
- hmc_pcm.py a Python module for used to hide the complexity of the HMC REST API as it returns multiple level XML, file name lists, and JSON data.
- nchart.py for generating the webpage (.html file) that uses JavaScript calls to the Google Chart library for graphing.
- Also, some sample config files.
- A single JSON file is used for the parameters of all the Python programs
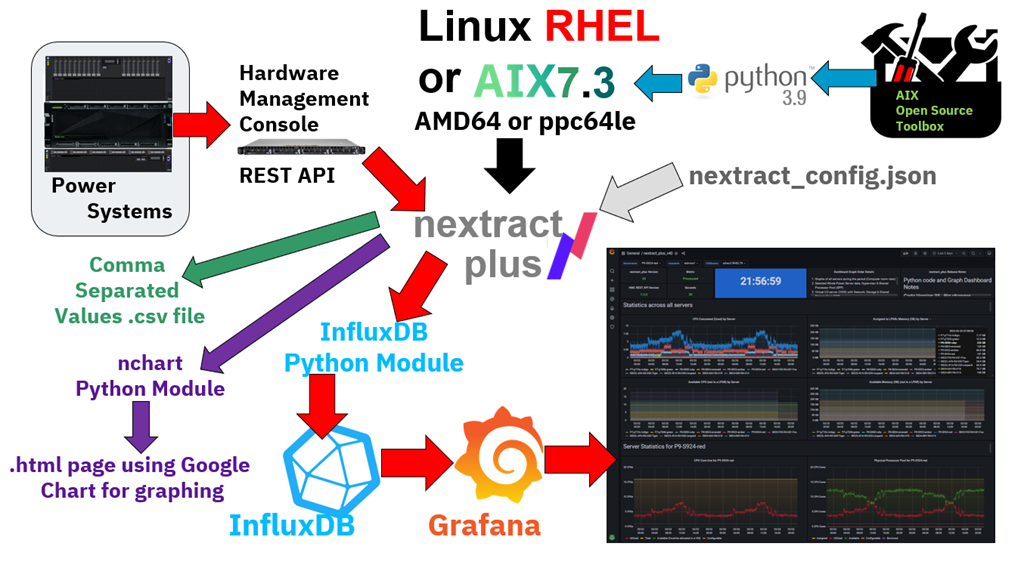
- I am using Red Hat Enterprise 8 and AIX 7.3. You could use other versions of Linux but Nigel can't offer full support on them.
- AIX 7.3 includes Python 3.9 but you can install Python on AIX 7.2 from the AIX open source toolbox.
- nextract_plus draws data from the HMC so it needs an HMC user account to log in. To make it obvious in a list of user accounts on the HMC, I use an account called nextractplus.
- nextract_plus.py (in the diagram) also includes the nextract_energy.py and nextract_ssp.py programs.
- All the programs can share a single JSON format configuration file. I use one config per HMC to keep things simple.
- Depending on the config the data is saved to a .csv file, a .html web page file or directly into InfluxDB.
- Use a freshly installed AIX 7.3 release as it includes Python 3.9 in the default installation and best for using AIX Open Source Toolkit packages.
- Install python3 pip module:
# dnf install python-pip.noarch - Then, install the influxDB python client module
# python3 -m pip install influxdb - I access python 3 using the command (from the $PATH list) /usr/bin/python3, which is a symbolic like to /usr/opt/python3/bin/python3.9
- Make sure the nextract_plus.py and hmc_pcm.py python programs refer to /usr/bin/python3 in the "hash bang" first line.
$ head nextract_plus.py #!/usr/bin/python3 # nextract_plus for InfluxDB and Grafana graphs import hmc_pcm as hmc import time import sys import json nversion=41 measures = 0 - And it then works with no changes.
- You have a log in account on an HMC with hscroot user access rights.
- Your Power Systems are POWER8 S822, POWER8 S824, POWER9 S922, POWER9 S924, Power10 S1022, or Power10 S1024.
- The Enterprise Servers do not appear to support the energy REST API. In particular: E880, E980, and E1080.
- POWER7 scale-out servers are unreliable.
- Your HMC is running version 9 or version 10 software with all available updates.
- You are running nextract_plus on Linux or AIX. It can work on MacOS or Windows as Python, InfluxDB and Grafana are available but you are on your own.
- You have InfluxDB 1.9.* (not tested on InfluxDB 2+ yet) and Grafana 9.* available. Do not use older versions. Both tools come in 3 editions:
- The open source edition - free to download and use on a wide range of AMD64 hardware and operating systems. For Power Systems AIX or RHEL download from https://www.power-devops.com/influxdb and https://www.power-devops.com/grafana
- Enterprise edition (to run on your own AMD64 based server) - requires a purchase or
- Cloud edition (to run on the vendors servers within their Cloud service) - requires renting the service.
- Any edition works - Nigel is using the open source edition as it is cheap and simpler to get going.
- You have Python 3 available.
$ sudo python3 -m pip install influxdb
$ sudo python3 -m pip list
Package         Version
--------------- ----------
 ...
influxdb        5.3.1
 ...
$
Note: InfluxDB client module version is 5.3 or higher.
mkdir temp
cd temp
python3 -m pip download influxdb

# List packages
ls -1
certifi-2020.12.5-py2.py3-none-any.whl
chardet-4.0.0-py2.py3-none-any.whl
idna-2.10-py2.py3-none-any.whl
influxdb-5.3.1-py2.py3-none-any.whl
msgpack-1.0.2.tar.gz
python_dateutil-2.8.1-py2.py3-none-any.whl
pytz-2021.1-py2.py3-none-any.whl
requests-2.25.1-py2.py3-none-any.whl
six-1.15.0-py2.py3-none-any.whl
urllib3-1.26.3-py2.py3-none-any.whl
# As root
python3 -m pip install *
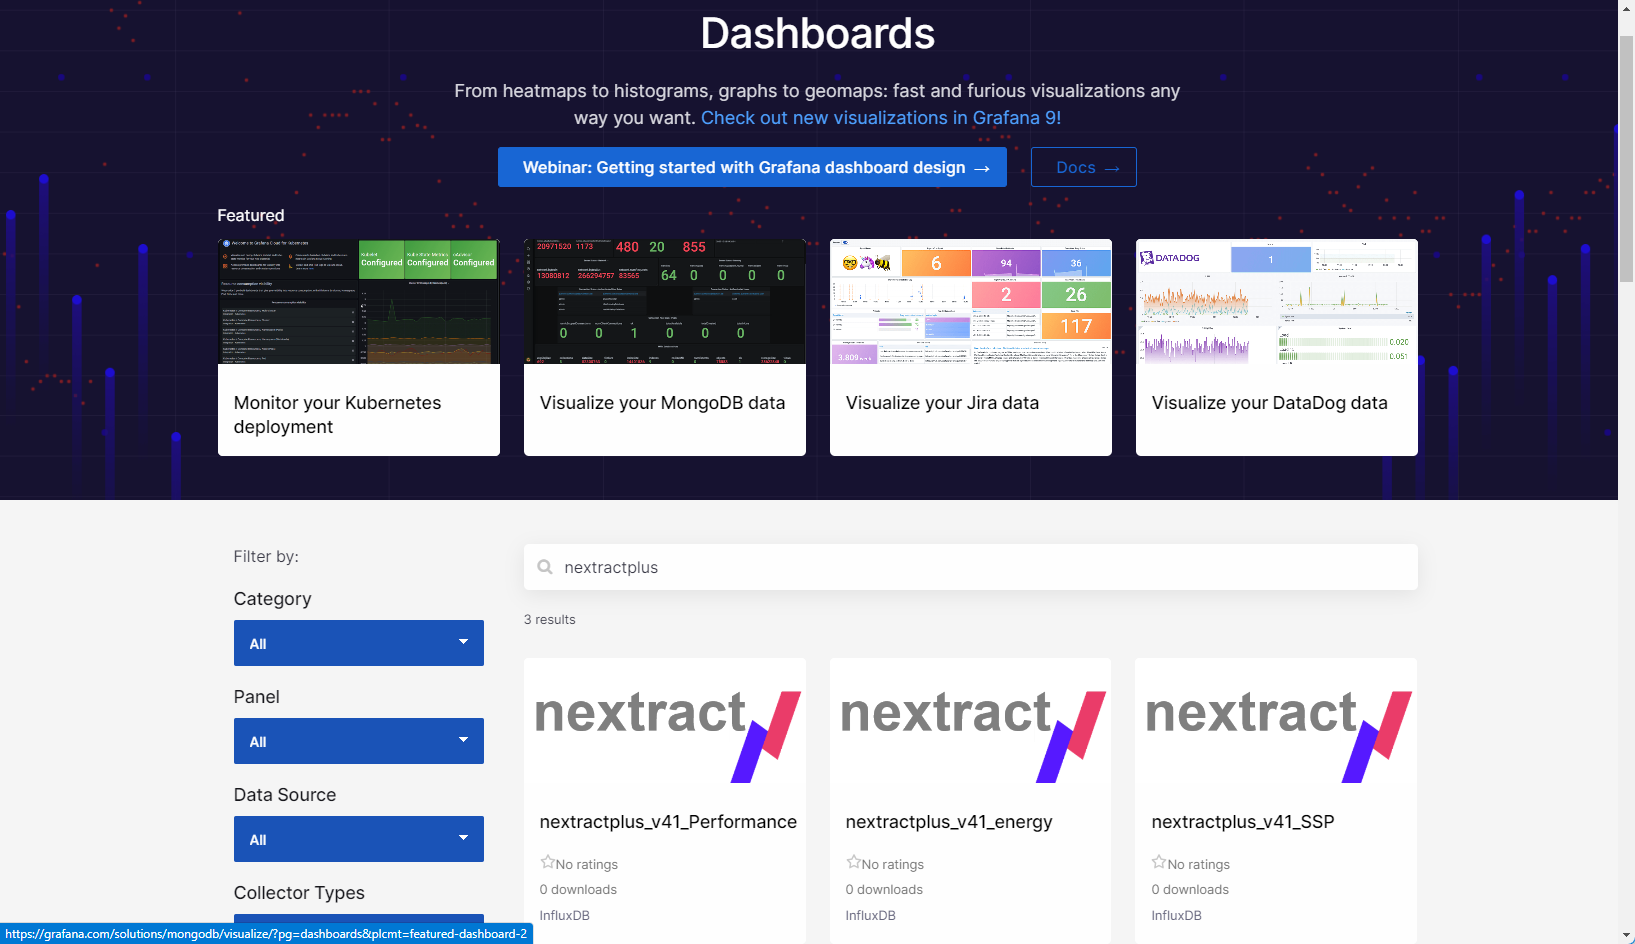
- nextractplus_v41_Performance ID = 17248
- nextractplus_v41_energy ID = 17259
- nextractplus_v41_SSP ID = 17261
Download
- The nextract_plus code and matching Grafana Dashboard are not downloaded from GitHub:
- https://github.com/nigelargriffiths/nextract
- Size: 54 KB
- Date: Dec 2023
- Improved debug.
- Added logging of the output statistics to InfluxDB. Set log = 1 inside the file. Data saved to output_log.json
- Fix for connecting to InfluxDB 2+ using a URL, Organisation, and Token
- Note: Upgrade the nextract_plus.py program. Collect data for 2 hours. Then, look at data from the last hour. Otherwise, you have data points in one graph with and without the new tags. This combination can be confusing.
- License
- nextract_plus.py Is only around 700 lines of simple Python code.
- It is more like a "code sample" converting HMC REST API JSON format data into InfluxDB line protocol "measurement" JSON format data and adding sending the data to a InfluxDB time-series database. Both of these data formats are publicly documented by their vendors - IBM and Influxdata.
- A code sample does not require a license or copyright.
Steps
On the HMC, setup "Data Collection" for your Servers
Log in to your HMC and the "All Systems" view

Select a POWER8 and POWER9 server and switch on "Data Collection":
- Click the tiny "pie chart" button.
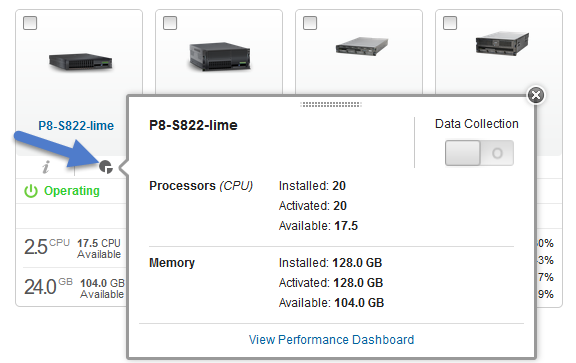
- If the upper right "Data Collection" is light green colored, then it is already on.
- If not, click the "O" button. Note: "O" means off and a "|" means on.

- You get a panel stating "Enable Data Collection"
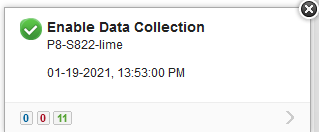
- Warning: This "Enabling" does not happen immediately but takes 10 minutes as a background activity. The user interface does not get immediately updated, so don't bother trying to enable it again.
- Check that it worked about 20 minutes later for the green color and a "|".
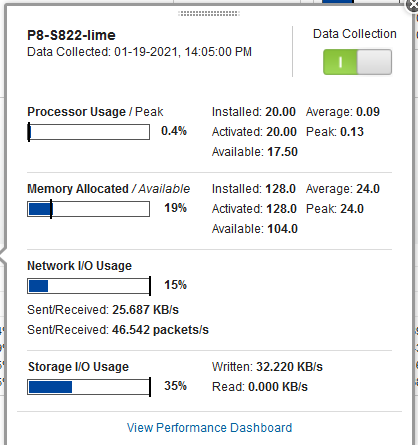
Data Collection
Each time you run the nextract_plus.py program, it collects the Performance data
- For the previous two hours
- At a sample rate of every five-minutes
- In an aggregated format - the average over the five-minute interval.
If you run the program, once an hour then you get one ours worth of overlapping data. This overlap is not a problem as the overlapped data is exactly that same numbers. This overlapping data can be reloaded into InfluxDB with no problems and no duplication of data. To reduce the compute time running the program, you could run the program once every two hours but then you have to wait up to two hours to see recent data. You have to decided what you want to do. There is not point in running it faster than once every 5 minutes.
I suggest:
- Running hourly using your crontab
- Once an hour, insures a good overlap that can help, if a virtual machine running the program or the machine running InfluxDB service is unavailable, being updated or rebooting.
- And if you want the latest data, right now, then run the program by hand.
- Make up your own mind.
- Capturing too often, does no harm but waits compute time.
- Capturing not often enough, means gaps in your graphs.
$ influx
> show databases
> create database nextractplus
> show databases
> exit
$
- These settings are determined during the initial InfluxDB setup that uses the InfluxDB graphical user interface (GUI)
- Make a note of the organization, bucket, and token settings
The code and files:
- hmc_pcm.py - unchanged from previous versions
- nextract_plus.py - new code to extract all the statistics.
The previous version did the basics at Server level and totals for the LPAR (VM) level. - nextractplus_v41_Performance-<number>.json The Grafana Dashboard definition, which matches this new code level.
The configuration parameters for the three nextractplus Python programs are stored in a JSON format config file.
To create a config file run:
$ ./nextract_plus.py >example_config.json

$ cat example_config.json
Usage:  ./nextract_plus.py version 41
./nextract_plus.py filename.json - use the JSON file to find the parameters
Example config.json
{
"hmc_hostname": "hmc15",
"hmc_user": "pcmadmin",
"hmc_password": "panda123sausages!",
"output_nchart": 0,
"output_json": 0",
"output_csv": 0,
"comment1": "Valid setting for output_influx = 0 (off), 1 or 2",
"output_influx": 1,
"comment2": "InfluxDB 1.x options",
"ihost": "myinflux",
"iport": "8086",
"idbname": "nextractplus",
"iuser": "fred",
"ipassword": "blogs",
"comment3": "InfluxDB 2.x options",
"iurl": "https://influx.acme.com:8086",
"ibucket": "default",
"iorg": "IBM",
"itoken": "123456780..abcdefg_etc.",
"comment4": "other parameters are ignored",
"comment5": "last name=value line has no ending comma"
}
Remove those top three lines from the config file so it looks like this:
{
"hmc_hostname": "hmc15",
"hmc_user": "pcmadmin",
"hmc_password": "panda123sausages!",
"output_nchart": 0,
"output_json": 0",
"output_csv": 0,
"comment1": "Valid setting for output_influx = 0 (off), 1 or 2",
"output_influx": 1,
"comment2": "InfluxDB 1.x options",
"ihost": "myinflux",
"iport": "8086",
"idbname": "nextractplus",
"iuser": "fred",
"ipassword": "blogs",
"comment3": "InfluxDB 2.x options",
"iurl": "https://influx.acme.com:8086",
"ibucket": "default",
"iorg": "IBM",
"itoken": "123456780..abcdefg_etc.",
"comment4": "other parameters are ignored",
"comment5": "last name=value line has no ending comma"
}
Notes on these parameters:
- The program parameters are JSON format file. JSON files are easy to parse into a Python dictionary. Any mistakes in the JSON format stop Python evaluating the parameters. Double check you have matching double quotation marks for string values and the item before the final curly closing brace does NOT have a comma.
- Set the hmc_hostname to the hostname of your Hardware Management Console (HMC). You need one config file for each.
- Set the hmc_username, and hmc_password to an account on the HMC with full hscroot access.
- If you want a html webpage output, which uses Google charts for the graphs, set output_nchart = 1.
- If you want the stats in JSON format, set output_json = 1.
- If you want a comma-separated values file output, set output_csv = 1.
- If you want the data sent to InfluxDB version 1, set output_influx = 1.
- If you want the data sent to InfluxDB version 2, set output_influx = 2.
- If output_influx = 1 then you need to set the following details
- Set ihost - To the InfluxDB servers hostname.
- Set iport - To the network port being used by Influx 1. The default is 8086.
- Set idatabase - To the database that you created in InfluxDB 1. I recommend "nextractplus".
- If you set a username and password for InfluxDB access, then set iuser and ipassword. If iuser and ipassword are not needed, then they are ignored by InfluxDB.
- If output_influx = 2 then you need to set the following details
- Set iurl - To "https://" + the InfluxDB servers hostname followed by ":8086". Assuming you are using the default InfluxDB port.
- Set ibucket - To the bucket (similar to a database name in InfluxDB 1), that you created as part of the InfluxDB setup. The default is "default". Advanced users can have multiple buckets too.
- Set iorg - To the users organization - that you created during the initial setting up InfluxDB 2.
- itoken - T0to the security token. You have to find the token on the Influx GUI for your user. The token is a long string of letters and numbers.
$ influx
> show databases
> create database nextractplus
> show databases
> exit
$
Have all the Python programs in the same directly.
Simply run the Python code: ./nextract_plus.py
The output starts like this (the sample includes a server called P9-S924-red):
$ ./nextract_plus.py
-> Logging on to hmc15 as hmc_username nag
-> Get Preferences
-> Parse Preferences
-> ALL servers:
-> Server name=P8-S822-lemon    agg=false longterm=false - remove
-> Server name=P9-S924-red      agg=true  longterm=true  - OK
-> Server name=P7-p730b-green   agg=false longterm=false - remove
-> Server name=P7-p710b-cyan    agg=false longterm=false - remove
-> . . .
-> Servers with Perf Stats

--> Server=1 Getting filenames for P9-S924-red
---> Received 17 file(s) in 3.26 seconds
---> Server=P9-S924-red File=1 ManagedSystem_0870cd27-ae34-3421-89e3-4825132237ce_20210119T104500+0000_20210119T124400+0000_30.json
---> Server=P9-S924-red File=2 LogicalPartition_5F0A663B-4EB1-424F-8643-7F417A8C9C97
---> Server=P9-S924-red File=3 LogicalPartition_085A4C6C-2ADF-4016-A33B-6602FA85665F
---> Server=P9-S924-red File=4 LogicalPartition_20D78650-9D62-415E-A882-C903A3DBAA2F
--->  . . .


ManagedSystem
---> Save readable JSON File=1 bytes=5088640
----> ServerInfo name=P9-S924-red mtms=9009-42A*7804930 type=Processed frequency=30 seconds
----> ServerInfo----> ServerInfo Date=2021-01-19 start=10:45:00 end=12:44:00
----> Server=P9-S924-red Filenames XML File=2 bytes=1319
----> Server=P9-S924-red Filenames XML File=3 bytes=1319
----> Server=P9-S924-red Filenames XML File=4 bytes=1319
----> Server=P9-S924-red Filenames XML File=5 bytes=1319
---->  . . .

Influx added 25089 records Server=P9-S924-red
The output is then followed by the details for each server.
If you get errors like this
* ERROR Server:P8-E850-ruby LPAR vm96withSSDviaVIOS3-4: status=2 errId=4002 from=VirtualIOServer
* ERROR Description="=vios: 3 is not in running state on Managed System: 8408-E8E*21D494V"

* ERROR Server:P8-E850-ruby LPAR vm96withSSDviaVIOS3-4: status=2 errId=3004 from=ManagedSystem
* ERROR Description="=Failed to fetch SRIOV adapter physical port statistics due to a technical error."
Then, nextract_plus keeps going but you need to investigate.
The first ERROR line points out that I have a Virtual I/O Server that is shut down. In my example case, it is a temporary test VIOS so that is not unexpected.
The second ERROR needs to be reporting by a PMR to be investigated
Note on ERROR:
- The code eliminates the reporting of duplicates otherwise the same error can be reported for every LPAR = 100's of times.
- Apparently, the HMC reports issues that are not a hard error, more like warnings or observations.
Setting up the Grafana Dashboard:
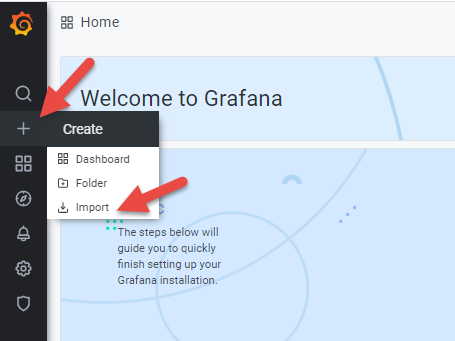
First, add the "nextractplus" InfluxDB database as a data source:

Click "Add data source" button:
![]()
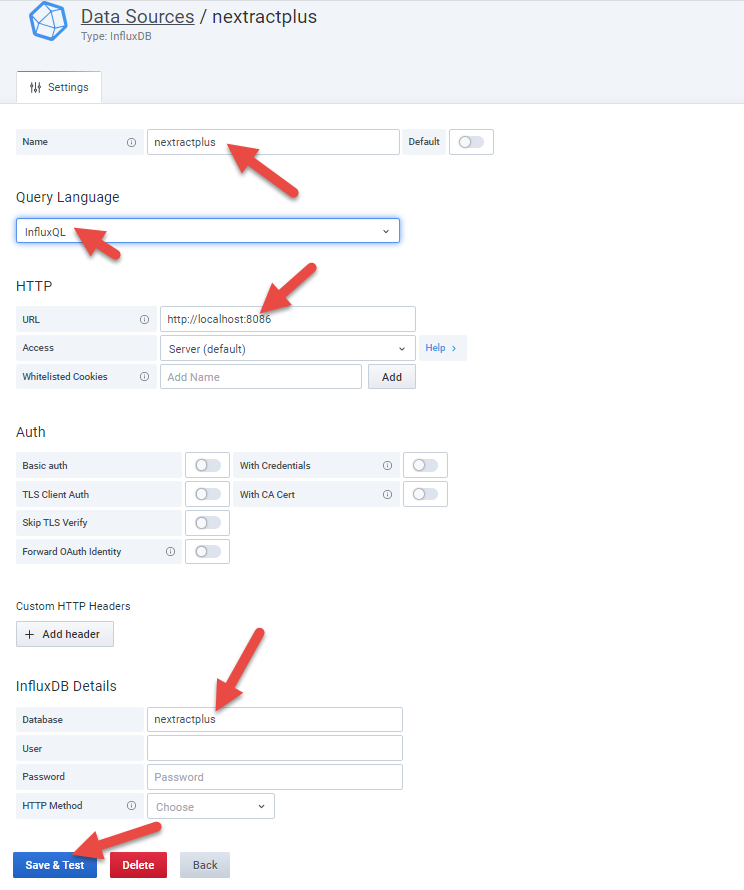
Select InfluxDB from the list of support data sources:

Add the data source detail - I used mainly the defaults:
Add the Grafana Dashboard
Next, add the working example of the nextract_plus Grafana Dashboard:
Click "Upload JSON file" button:
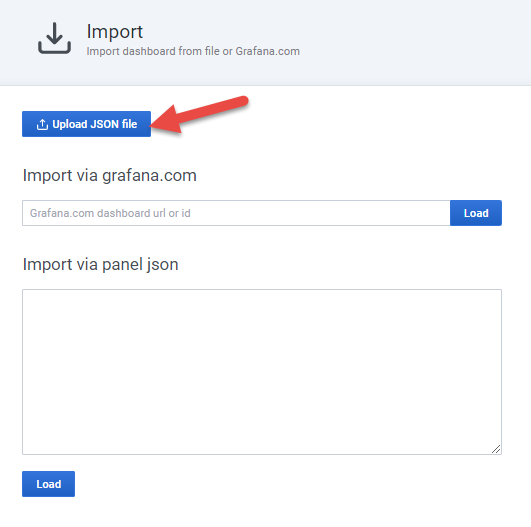
Select the file nextract_plus_v20-1611011229698.json from the downloaded the .zip compressed file. Check the data source (lowest field) has the "nextractplus" as the data source:
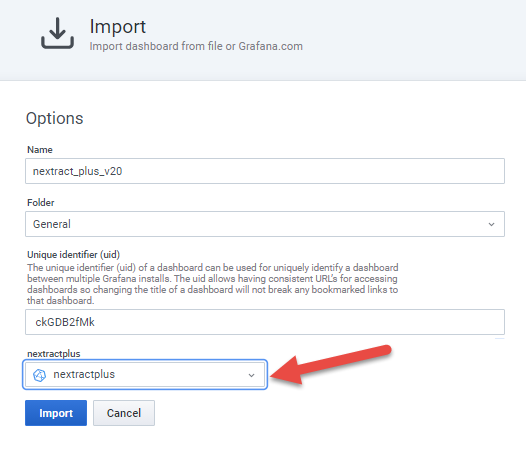
And click the "Import" button.
The graph dashboard is displayed. Select a time-range suitable for the amount of data that you collected so for example, the last hour or 2 days, depending on how load you have regularly run nextract_plus.
The nextract_plus Dashboard
Here are the first few screens on my 27-inches screen:

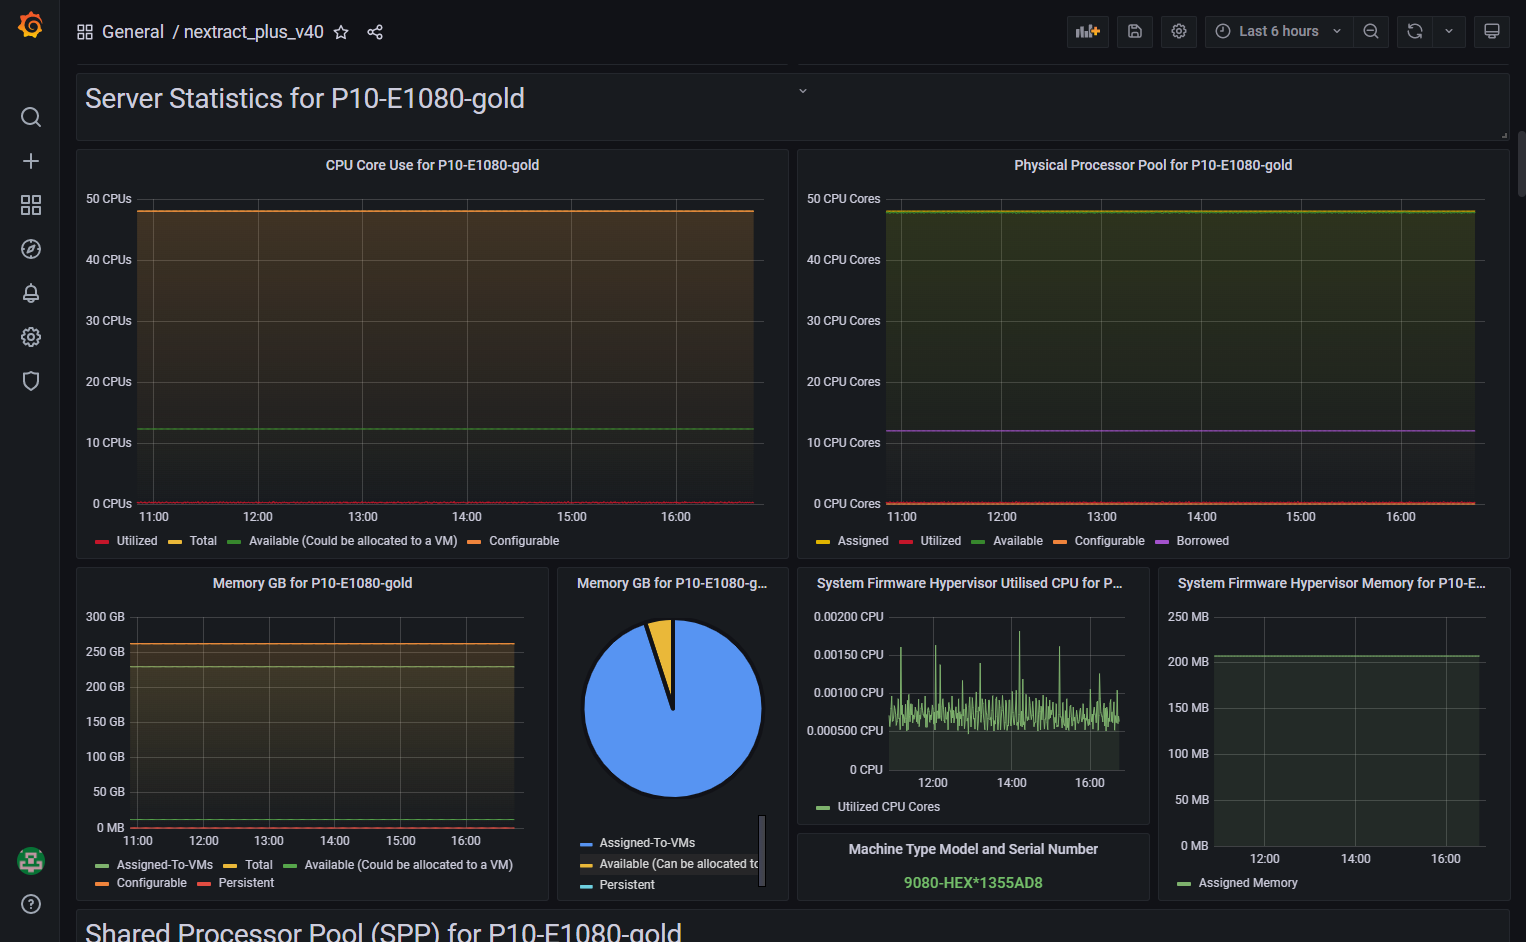

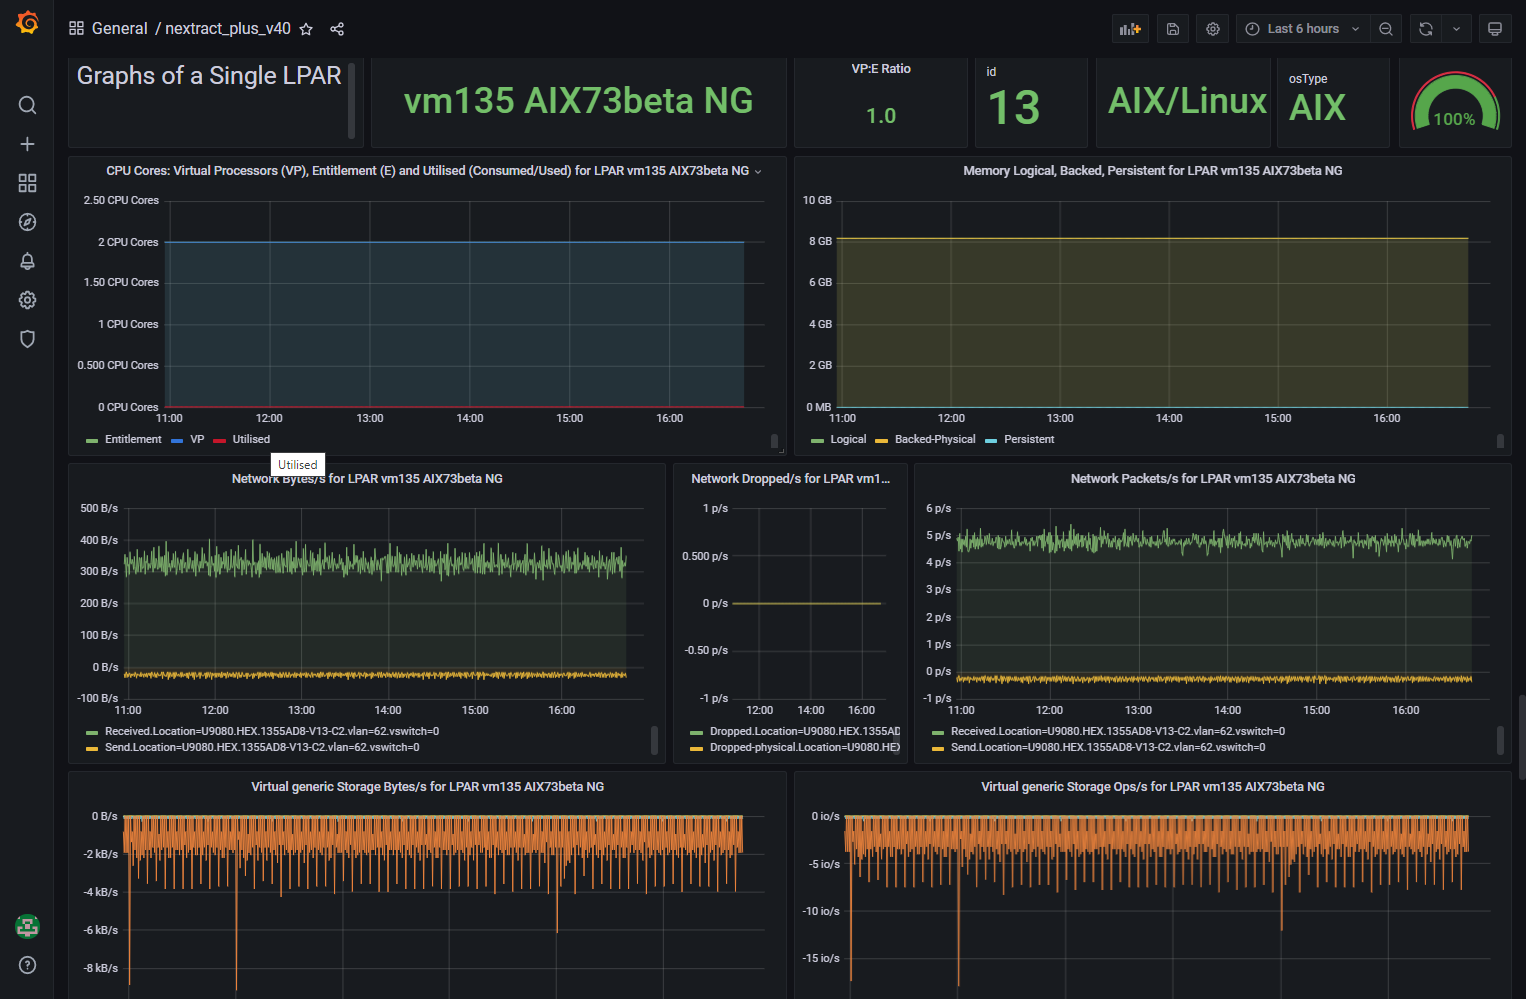
Notes on the nextract_plus Dashboard:
- Select a suitable time range.
- There are many pages of graphs to scroll down too.
- Grafana does "lazy displaying". The term means it does not draw the graphs that are not visible on the screen to reduce spikes on your workstation CPU as the dashboard is first displayed. If you scroll down and the graph area is visible, it takes a few seconds to draw them.
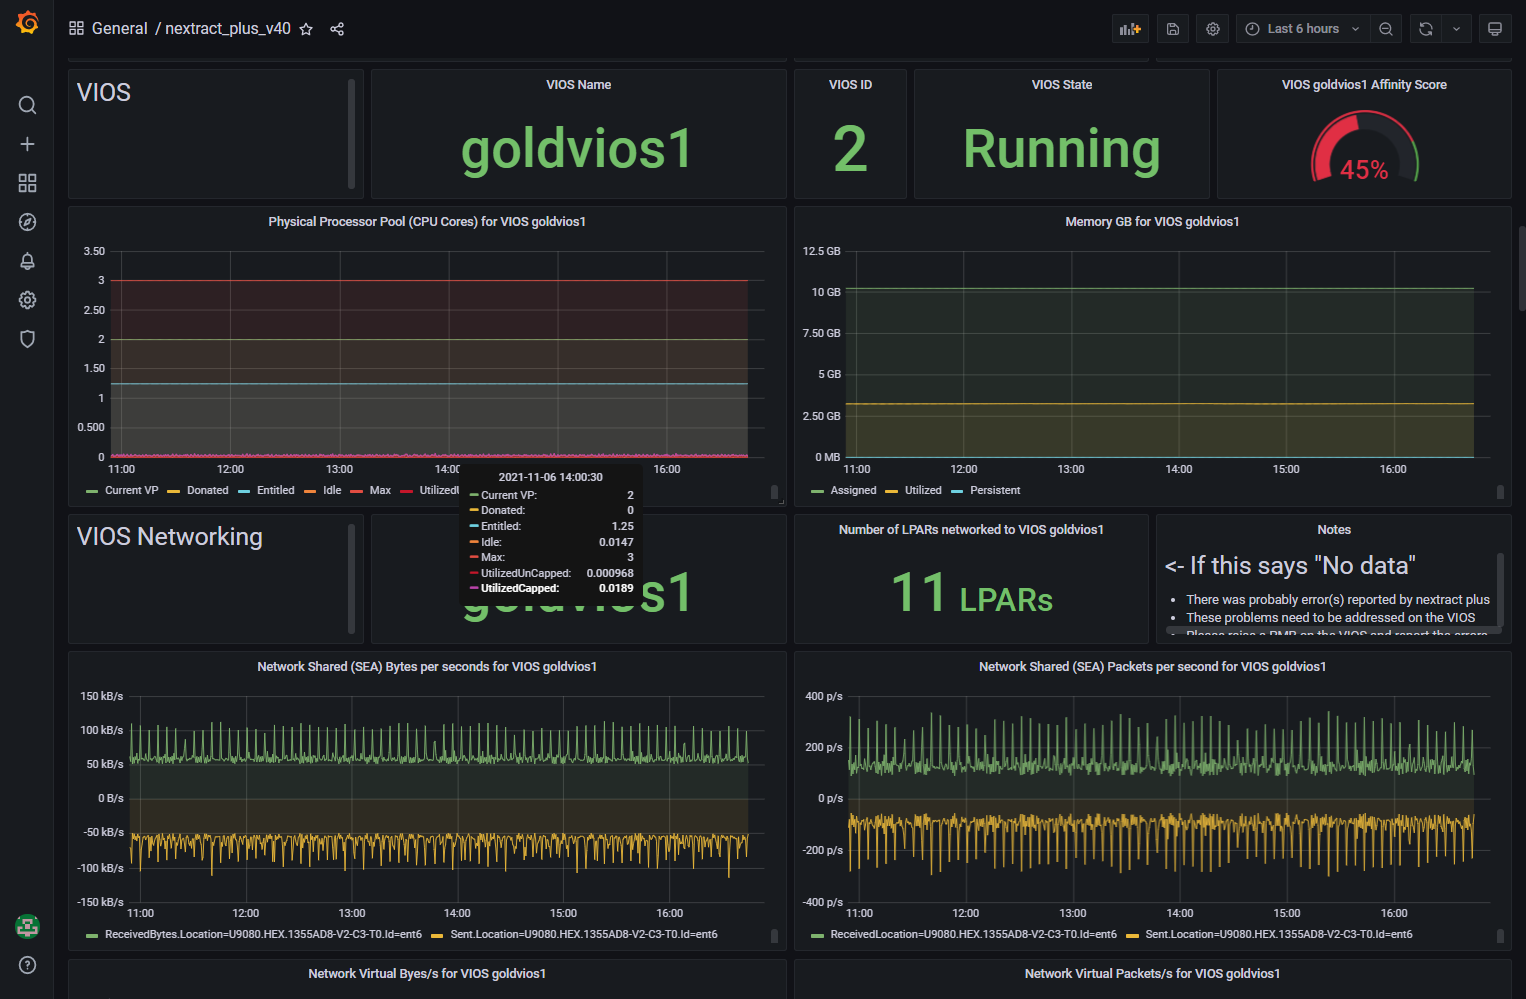
- The three dashboard variables at the top named "Servername", "viosname", and "LPARname" are not interlinked. So the VIOS named might not be on the Server selected. The same goes for the "LPARname." If you select a VIOS that is not on the selected Server, then you get "N/A" or "No Data" warnings.
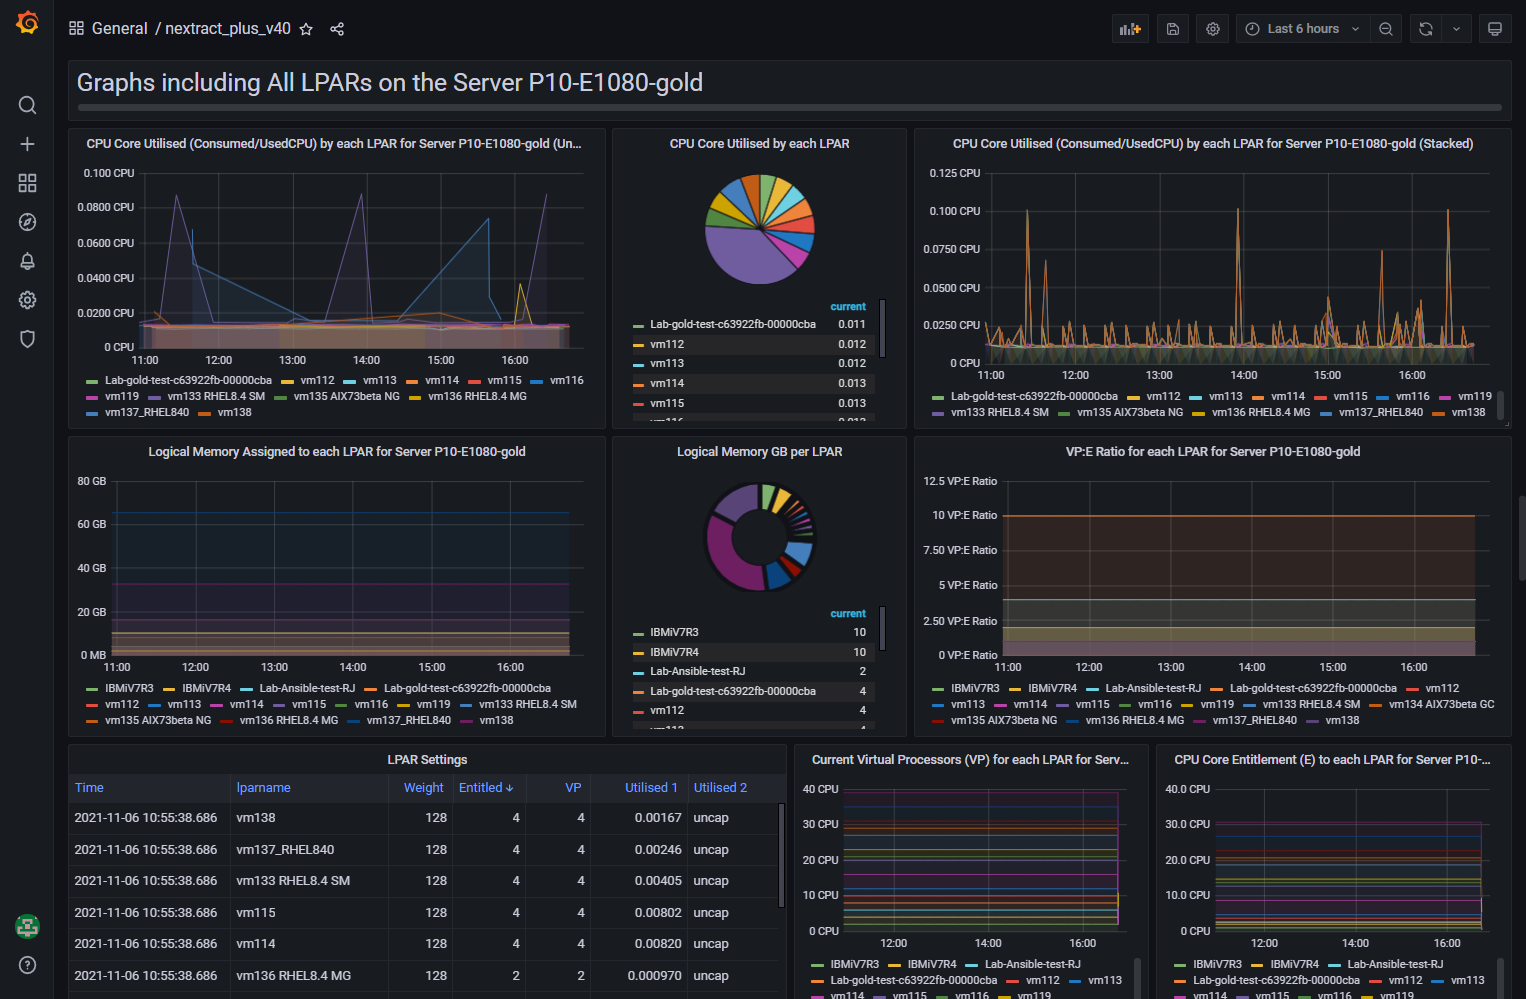
- The "Graphs including All LPARS" means the LPAR on the Selected Server. These graphs show the LPARs on the Server selected - which is useful. But on Servers with 100's of LPARs is going to become a mess due to too many names and graph lines - best to zoom in on the graph. Hint: hover the cursor over the graph and type: v
- The time per instruction often shows nothing unless the server is busy.
- The Dashboard needs more work.
Reporting problems:
- Make sure you have the usernames and password correct by trying them by hand.
- Switch on debug output in the "nextract_plus.py" program "debug=1"
- Run the program and save all the output:
./nextract_plus.py config.json 1>plus.out 2>plus.err - Return the two files
- Run the following "influx" commands. These commands are interesting, even if you have no problems as it confirms you have data in InfluxDB.
-
$influx > show databases > use nextractplus > show measurements > select count(*) from server_details > select count(*) from vios_details > select count(*) from lpar_details > select LAST(*) from server_details > select LAST(*) from vios_details > select LAST(*) from lpar_details > exit - Return the output
Warranty = none
- It is strictly "at your own risk".
- As nextract_plus only passively takes data from the HMC, it does not create any HMC objects.
- Recent HMC code versions seem to clean up failed REST API sessions.
- If there are problems on the InfluxDB side, then disabling is easy. Use the "influx" command to "drop database nextractplus" to remove all the old data and stops any data further saving of the data.
- For Managed Systems (Server and VIOS level)
Processed_Aggregated_Managed_System_JSON_Specification - For Logical Partitions (LPAR level)
Processed_Aggregated_Logical_Partition_JSON_Specification
Additional Information
- Find it here http://public.dhe.ibm.com/systems/power/docs/hw/p9/p9ehl.pdf
- Managed System Processed and Aggregated Metrics JSON Specification page 248
- Logical Partition Processed and Aggregated Metrics JSON Specification page 252
| Managed System | nextract_plus Version 31 | nextract_plus Version 32 onwards (if different from 31) | Tested |
| systemFirmware | server_details | Yes | |
| processor | server_processor | Yes | |
| memory | server_mem | server_memory | Yes |
| physicalProcessorPool | server_physicalProcessorPool | Yes | |
| sharedMemoryPool (Active Memory Sharing = AMS) | server_sharedMemoryPool | NO 1 | |
| sharedProcessorPool | server_sharedProcessorPool | Yes | |
| network sriovAdapters Ports | server_sriovport | server_sriov | Yes |
| network HEAdapters Ports (older SRIOV type technology not available on POWER8 or POWER9) | server_HEAport | server_hea | NO 2 |
| VIOS | vios_details | Yes | |
| memory | vios_memory | Yes | |
| processor | vios_processor | Yes | |
| network clientLpars list | vios_network_lpars | Yes | |
| network genericAdapters | vios_network_generic | Yes | |
| network sharedAdapters | vios_network_shared | Yes | |
| network virtualEthernetAdapters | vios_network_virtual | Yes | |
| network sriovLogicalPorts | vios_network_sriov | NO 3 | |
| storage clientLpars list | vios_storage_lpars | Yes | |
| storage genericVirtualAdapters | vios_storage_genericVirtual | vios_storage_virtual | Yes |
| storage genericPhyiscalAdapters | vios_storage_genericPhysical | vios_storage_physical | Yes |
| storage fiberChannelAdapters | vios_storage_FC | Yes | |
| storage sharedStoragePool | vios_storage_SSP | Yes | |
| LPAR | lpar_details | Yes | |
| memory | lpar_mem | lpar_memory | Yes |
| processor | lpar_processor | Yes | |
| network virtualEthernetAdapters | lpar_net_virtual | Yes | |
| network sriovLogicalPorts |
lpar_net_virtual
BUG totally the wrong name
|
lpar_net_sriov | NO 4 |
| storage genericVirtualAdapters | lpar_storage_vSCSI |
lpar_storage_virtual
|
NO 5 |
| storage virtualFiberChannelAdapters | lpar_storage_virtual_FC | lpar_storage_vFC |
Yes
|
- The "network sriovLogicalPorts" had a large bug. It had the wrong measurement name and duplicate with "lpar_net_virtual".
- The HMC some statistics are adapters and some ports, which then have adapters names and port details with is unnecessary - IMHO.
- Some measurements are renamed for consistency and clarity.
- From the tested column:
- The rows marked with "Yes"are tested from my own HMC and servers and included in the new Grafana dashboard graphs for this new version 32.
- The rows marked with a "NO" are resources that I do not have examples of so the HMC does not give details of what the stats look like. In particular, statistics like resource names and IDs. A program was developed to fake these resources and so graph them but it is a shot in the dark. These graphs are at the end of the nextract_plus dashboard for version 32 onwards under a banner of Experimental Graphs.
- If you have these resources, I would like examples from you in a JSON format file
- Then, run a capture and send the file in the current directory called nextract_plus.json to me nag@uk.ibm.com. Compress the output file to reduce the file size with gzip or zip.
> show databases
name: databases
name
----
_internal
njmon
temperature
nextractplus


> use nextractplus
Using database nextractplus


> show measurements
name: measurements
name
----
lpar_details
lpar_memory
lpar_net_sriov
lpar_net_virtual
lpar_network_sriov
lpar_processor
lpar_sriov
lpar_storage_vFC
lpar_storage_virtual
server_details
server_hea
server_memory
server_physicalProcessorPool
server_processor
server_sharedMemoryPool
server_sharedProcessorPool
server_sriov
vios_details
vios_hea
vios_memory
vios_network_generic
vios_network_lpars
vios_network_shared
vios_network_sriov
vios_network_virtual
vios_processor
vios_sriov
vios_storage_FC
vios_storage_SSP
vios_storage_lpars
vios_storage_physical
vios_storage_virtual


> show field keys
name: lpar_details
fieldKey      fieldType
--------      ---------
affinityScore integer
id            integer
name          string
osType        string
state         string
type          string

name: lpar_memory
fieldKey             fieldType
--------             ---------
backedPhysicalMem    float
logicalMem           float
virtualPersistentMem float


name: server_details
fieldKey          fieldType
--------          ---------
APIversion        string
assignedMem       float
frequency         integer
metric            string
mtm               string
name              string
nextract          string
utilizedProcUnits float

. . . .

name: vios_details
fieldKey      fieldType
--------      ---------
affinityScore integer
viosid        integer
viosname      string
viosstate     string

name: vios_memory
fieldKey             fieldType
--------             ---------
assignedMem          float
utilizedMem          float
virtualPersistentMem float

. . . .

> show tag keys
name: lpar_details
tagKey
------
lparname
servername

name: lpar_memory
tagKey
------
lparname
servername

name: lpar_net_sriov
tagKey
------
lparname
physicalLocation
physicalPortId
servername

name: lpar_net_virtual
tagKey
------
location
lparname
servername
viosId
vlanId
vswitchId

. . . .

> select count(*) from server_processor where servername ='P9-S924-red'
name: server_processor
time count_availableProcUnits count_configurableProcUnits count_totalProcUnits count_utilizedProcUnits
---- ------------------------ --------------------------- -------------------- -----------------------
0    20909                    20909                       20909                20909

> select last(*) from server_processor where servername ='P9-S924-red'
name: server_processor
time last_availableProcUnits last_configurableProcUnits last_totalProcUnits last_utilizedProcUnits
---- ----------------------- -------------------------- ------------------- ----------------------
0    4.15                    16                         16                  9.6209
>
Document Location
Worldwide
Was this topic helpful?
Document Information
Modified date:
19 December 2023
UID
ibm16405910