Troubleshooting
Problem
This document describes how to use the system service tools macro SYSTEMHEAPS output to determine the address and current size of these heaps. This support can also be used to monitor for growth of these heaps.
Resolving The Problem
Use these steps to collect and review the SYSTEMHEAPS macro output from system service tools:
STEP 1: Collect the output:
- STRSST <enter>
- Specify credentials <enter>
- 1. Start a service tool <enter>
- 4. Display/Alter/Dump <enter>
- 2. Dump to printer <enter>
- 2. Licensed Internal Code (LIC) data <enter>
- 14. Advanced analysis <enter>
- Specify an option of 1 and the command SYSTEMHEAPS <enter>
- On the Options screen press <enter>
- Specify a dump title <enter>
- Exit system service tools by pressing F3 <exit> and watch for one of these messages:
If the following message appears, then take option 7. Display dump status and wait until the dump completes.
Dumps still incomplete. Press F3=Exit or F12=Cancel to end.
If the following message appears, then continue to press F3 <exit> and <enter> to exit System Service Tools
Dump completed normally -SAMPLE 1
STEP 2: Review the output:
- WRKJOB OPTION(*SPLF) <enter>
- Locate the spooled file named QPCSMPRT and take option 5=Display <enter>
- See the details and examples below to understand the output.
- Multiple SYSTEMHEAPS can be taken over time to determine if the heaps are increasing in size.
- A heap can have at most 100 control segments. Both the Resident heap and System heap below show 'Number of control segments' of 1.
- A recovery action will be required when a heap reaches 100 control segments.
- An IPL will be required if either System heap or Resident heap reach 100 control segments.
- A wide variety of failures with an impact to a large number of jobs is possible when a heap reaches 100 control segments.
- Heap is temporary storage and an IPL will generate a new heap. - There are two primary sections in the output. These sections start and end with the text shown below in Section 1 and Section 2.
- The most interesting part of Section 1 is the "Total resident storage used...", which is the current size of all the heaps in this section.
- The most interesting part of Section 2 is the "Total pageable storage used...", which is the current size of all the heaps in this second.
- All sizes are stated in pages. A page is 4096 bytes.
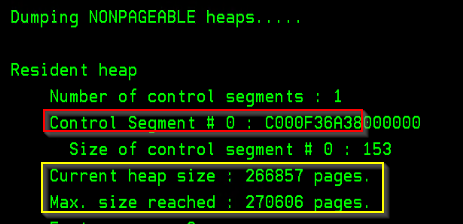
- Section 1:
Dumping NONPAGEABLE heaps.....
...
...
Total resident storage used by above heaps = <number> pages.
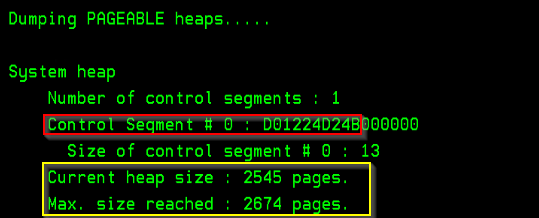
- Section 2:
Dumping PAGEABLE heaps.....
...
...
Total pageable storage used by above heaps = <number> pages.
- Example Heap Details:
Both sections will have multiple heaps listed, but all have the same format.- Control Segment #0 is the address of the heap. C000F36A38 and D01224D24B in the two examples.
- Current heap size is the size of the particular heap in pages.
- Max. size reached is the maximum size the heap has reached in pages.
[{"Type":"MASTER","Line of Business":{"code":"LOB57","label":"Power"},"Business Unit":{"code":"BU058","label":"IBM Infrastructure w\/TPS"},"Product":{"code":"SWG60","label":"IBM i"},"ARM Category":[{"code":"a8m0z0000000CGHAA2","label":"MustGather"}],"ARM Case Number":"","Platform":[{"code":"PF012","label":"IBM i"}],"Version":"All Versions"}]
Historical Number
587269612
Was this topic helpful?
Document Information
Modified date:
05 March 2024
UID
ibm16557332