Technical Blog Post
Abstract
MQ on IBM Sterling Order Management on cloud - Checklist for peak
Body
IBM MQ-based integration is supported by IBM to integrate IBM Order Management with any external third-party system.
In gearing up for the peak season, the following with help all OMoC customers-
1. Please have MQ client set up to access production and preprod environments. This provides an easy way to access queues and note details like queue depth.
Instructions to set up MQ client at - https://www.ibm.com/support/knowledgecenter/en/SSGTJF/com.ibm.help.omcloud.extinteg.doc/integration/t_omc_install_mqclient.html
2. Self serve options related to MQ are also available, the list of supported functions are available in the below link -
https://www.ibm.com/support/knowledgecenter/en/SSGTJF/com.ibm.help.omcloud.extinteg.doc/integration/r_omc_integmqselfserveops.html
3. During performance testing, there may be situations where some queues need to be cleared. Using the self server option to Manage queue - clearQueue can be used to this effect.
In certain cases, having an open connection to the queue can prevent the queue from being cleared. If this connection is from an external system , there could be considerable time being spent in completing this task. The option of creating an integration server to help drain off the messages from the queue would help in such cases.
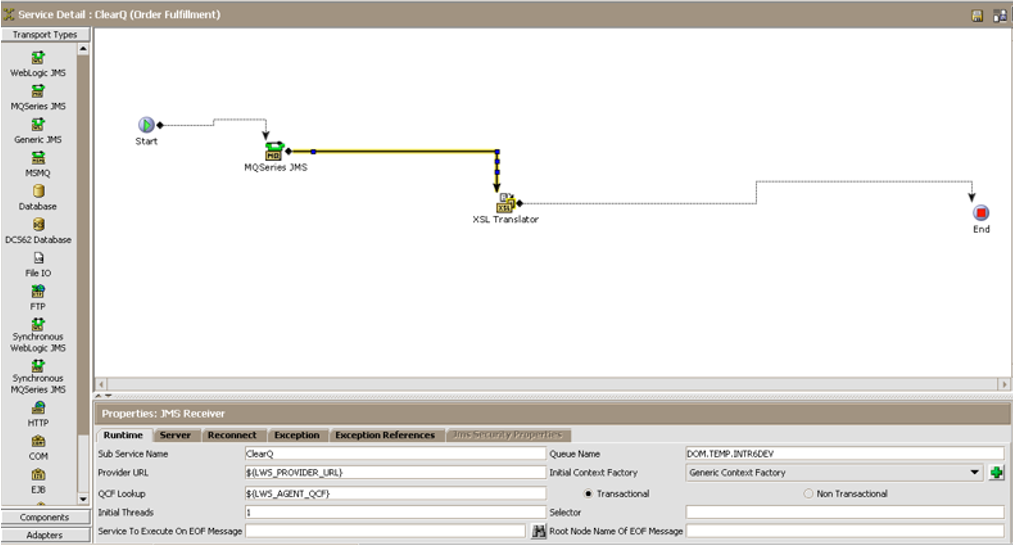
This simple set up can be used to drain messages off a queue (that can be entered under Queue Name) without having to worry about other applications connected to the queue. A dummy XSL can be entered in the component XSL Translator
4. If connectivity issues are seen related to MQ during message put, you can look into the option of Exporting MQ logs, these are exported to dropbox
https://www.ibm.com/support/knowledgecenter/en/SSGTJF/self_service/noniks_ss_processes.html
The logs can help provide an initial look into where the issue lies. Commonly seen issues include -
- AMQ9513: Maximum number of channels reached
This is reported when a client application attempts to connect to the queue manager and the specified maximum number of channels are in use. Please raise a case with IBM Support to understand if a specific server is responsible to consuming too many connections or if the number of channels should be increased.
- AMQ7487: Application x was preventing log space from being released
This indicates that an application is responsible for a long running unit of work and the current log space may be insufficient.
Please raise a case with IBM Support to have this reviewed further and action.
- In some cases, the internal agents, integration servers and application servers are able connect to MQ with no issues. However external applications (that use MQIPT) may face issues accessing MQ. In this case, the number of external listener connections may need to be incremented.
5. If you suspect slowness related to MQ puts from an agent server, look into the MessageBufferPutTime in relation to ExecuteMessageCreated from the yfs_statistics_detail. MessageBufferPutTime /ExecuteMessageCreated would provide the time taken to put one message to the queue where-
MessageBufferPutTime - the total amount of time putting tasks into the message queue
ExecuteMessageCreated - the total number of tasks put in the message queue
6. When there is a multi-threaded AppServer scenario sending messages to MQ, there is a chance of thread congestion. To mitigate this,explore the option of setting yfs.yfs.jms.sender.multiThreaded=true
If there are large number of threads running for a server and send to the queue is not to be synchronized, set this property to true. Note that setting this property to true can cause an elevation in resource usage, so if this property is set to true and the number of threads sending messages to the queue is high, you should evaluate the impact of the increased resource usage.
7. Self serve now has a dashboard to view JMS metrics.
The JMS metrics dashboard contains five charts. In this dashboard, you can view information about the connections to the IBM MQ, connection state for unit of work, bytes that are received and sent, queue depth for top 20 queues, and the queue statistics. These are updated every minute and can be utilized for proactive monitoring - https://www.ibm.com/support/knowledgecenter/en/SSGTJF/self_service/DashboardWidgets.html
UID
ibm11124349