Troubleshooting
Problem
User launches Planning Analytics Administration (PAA) website. User clicks on the 'Administration' button. User clicks on the tab 'Databases'.
The dashboard shows all the PA instances running (in that environment). User looks at one of the PA instances, and sees that the 'Memory Usage' is higher than they expect.
Why is the memory usage so high?
Symptom
Example:
Imagine a scenario where:
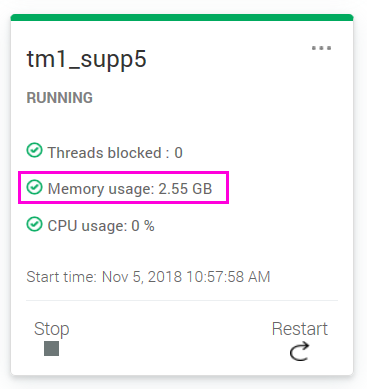
- PAA dashboard shows memory usage of instance 'tm1_supp5' to be: 2.55Gb
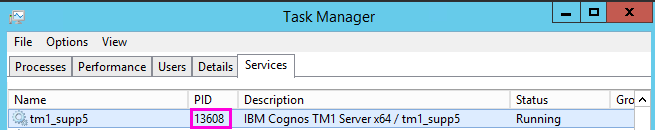
- The user then looks on the PA server which is hosting the instance. Inside 'Task Manager' they can see that this service relates to PID = 13608
- Inside tab 'Details' they look at that PID, and find that the relevant executable (tm1sd.exe) is only consuming 1.1Gb of RAM:
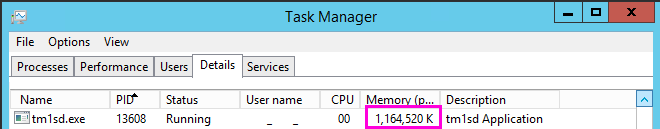
Why is the amount of RAM consumed by the Windows process (tm1sd.exe) less than the value shows in the PAA dashboard item 'Memory Usage'?
Cause
There are other possible causes for the 'memory' usage being unexpectedly high, for example:
- Model is very complex, causing it to naturally consume lots of memory
- TIP: For more scenarios/information, see DeveloperWorks article "TM1 Server Memory Diagnostics" (link below).
However, this Technote specifically relates to the scenario where the cause is that the user is incorrectly assuming what the value of 'memory usage' is actually measuring.
- Specifically, this value is not the same as the memory used by the Windows process ( 'tm1sd.exe') which runs the relevant PA instance's Windows service.
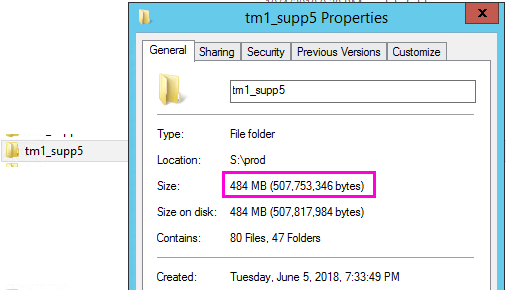
For the record, the 'memory usage' value does not relate to the size of the 'data' portion of the PA instance.
- For example, in the above scenario the size of the model was less than 0.5Gb:
Resolving The Problem
The 'memory usage' represents the sum of physical memory (RAM) and the pagefile (Windows disk swap) allocation consumed by the database.
- For more details, see separate IBM article 'Monitor and administer databases'.
Example:
In the above example:
- 1.1Gb memory was consumed in memory (RAM chips)
- 1.4Gb memory was consumed in page file (hard drive disk space).
More Information:
PA/TM1 does not release the memory back to the operating system until the TM1 server is stopped or restarted. Instead, TM1 puts memory it no longer needs into a 'garbage list' (to be reused as required).
=> Therefore the memory consumption (for the TM1 server/instance), as reported by the operating system, is the total of:
- the actual current memory usage
- plus the garbage memory.
To get an accurate report of the actual memory usage and garbage memory, you can view the }StatsForServer control cube.
- TIP: For more information on this, see documentation on 'Control Cubes' (link below)
Related Information
Document Location
Worldwide
[{"Business Unit":{"code":"BU059","label":"IBM Software w\/o TPS"},"Product":{"code":"SSD29G","label":"IBM Planning Analytics"},"Component":"","Platform":[{"code":"PF033","label":"Windows"}],"Version":"All Versions","Edition":"","Line of Business":{"code":"LOB10","label":"Data and AI"}},{"Business Unit":{"code":"BU059","label":"IBM Software w\/o TPS"},"Product":{"code":"SSD29G","label":"IBM Planning Analytics"},"Component":"","Platform":[{"code":"PF033","label":"Windows"}],"Version":"All Versions","Edition":"","Line of Business":{"code":"LOB10","label":"Data and AI"}}]
Was this topic helpful?
Document Information
Modified date:
20 September 2021
UID
ibm10879835