How To
Summary
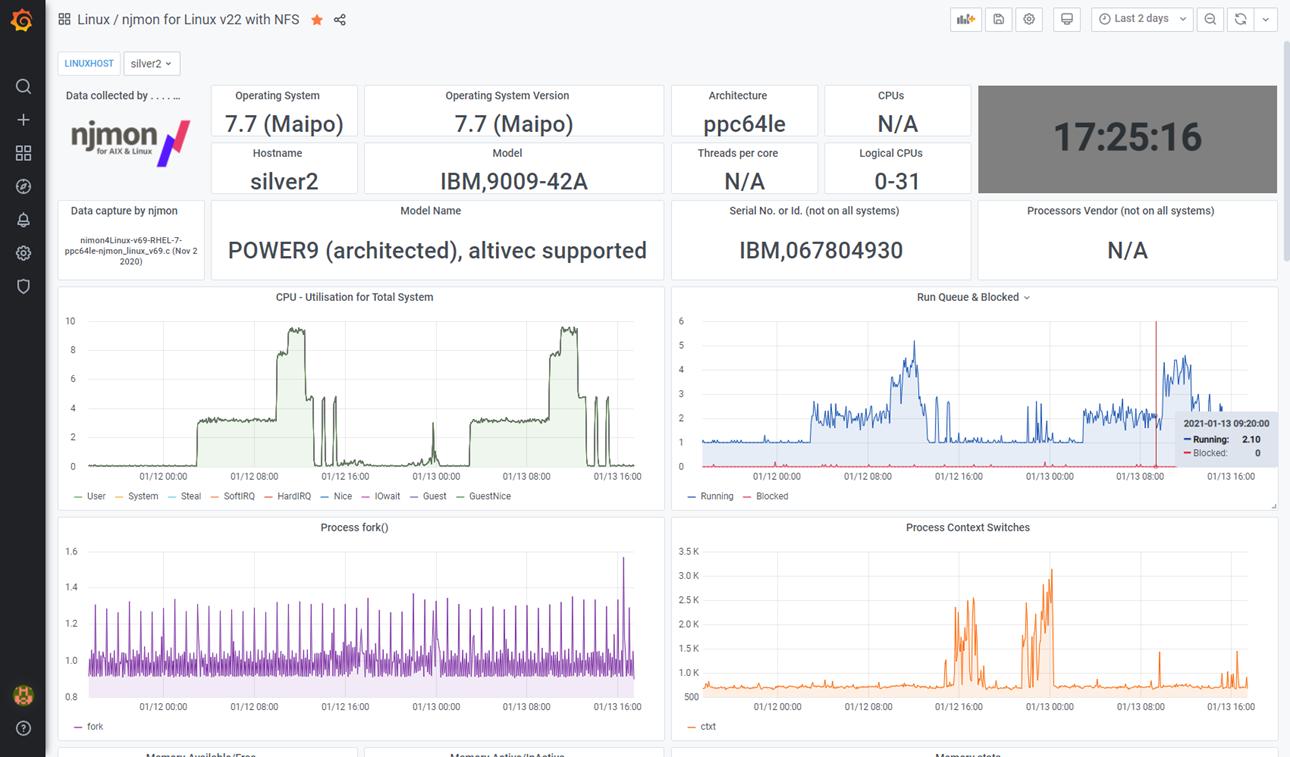
When I show technical folk my njmon performance tool and InfluxDB with Grafana, they assume that must be complicated to set up but it is not true. On Linux, installing is simple and quick. Heck, you can also use Microsoft Windows and Mac OS for a quick go but you really want to run it as on a server so its 24 x 7. Thanks to amazing team are power-devops.com we can also use AIX and Linux on POWER8 and POWER9 - my favourite servers. InfluxDB and Grafana are simple and quick to install. Then, you have the best Time-series database (in my opinion) and the best browser-based performance stats graphing tool Grafana, ready for njmon data. I estimate the tasks details here will take 10 to 15 minutes.
You can cut'n'paste most of the commands directly. With Linux on Intel, you have Red Hat, SUSE and Ubuntu. In this blog, I am using RHEL - as an IBMer I have to! Apart from the software package format and install command name, the process is the same regardless of Linux Distro.
Objective

Environment
- A freshly installed Red Hat 8.2 and you have system admin access.
- We are going to take all the default settings including using the root file system for the InfluxDB data. It is your option to set-up a separate file system for this data. Alternatively, use a large root file system. I suggest a root file system of 1 TB or more. If this is a quick proto-type to throw away then even 64GB is fine.
- Internet access from the server. Alternatively, you could download and copy over the installation files by hand.
- Latest versions for InfluxDB and Grafana (at the time of writing this blog) InfluxDB 1.8.3 and Grafana 7.3.6.
- For Intel go here: https://portal.influxdata.com/downloads/ and https://grafana.com/grafana/download
- For POWER8 go here: and POWER9 servers the latest versions here https://www.power-devops.com/influxdb and https://www.power-devops.com/grafana
- I have not tested InfluxDB version 2 yet. I think version 2 has excellent compatibility with an earlier version and work fine. For an early easy successful first time, use InfluxDB 1.8
- The root user is used throughout.
- We will be using default network ports 8086 for InfluxDB and 3000 for Grafana.
- Assuming you have the correct time or an Network Time Protocol process and you are not going to change the hostname after install (possible but not covered here).
- Both InfluxDB and Grafana have a text config file for advanced options. You can study these options after you have successfully installed and have graphed your first statistics.
Steps


Additional Information
Find more content from Nigel Griffiths (retired) here:
- YouTube https://www.youtube.com/nigelargriffiths with ~215 Videos on AIX, Linux and Power Server technology
- AIXpert Blog https://www.ibm.com/support/pages/aixpert-blog-nigel-griffiths-mrnmon
Document Location
Worldwide
Was this topic helpful?
Document Information
Modified date:
09 June 2023
UID
ibm16403836