Troubleshooting
Problem
After attempting to display an imported dashboard, you either see an empty page, or see an error similar to the one below in place of one or more of its visualizations:
"Could not locate that visualization (id: fed6da7e-4db4-4e32-b2e0-5a59d044cdea)"
"Could not locate that visualization (id: fed6da7e-4db4-4e32-b2e0-5a59d044cdea)"
Symptom
Following this step:
- Import a dashboard and its visualizations from one catalog into another.
- Attempt to display the imported dashboard.
You arrive at this error:
- You either see an empty page, or see an error similar to the one below in place of one or more of its visualizations:
"Could not locate that visualization (id: fed6da7e-4db4-4e32-b2e0-5a59d044cdea)"
Cause
A dashboard contains visualization components. These have unique IDs.
When you export a dashboard from a catalog, the generated JSON refers to these visualization components by using these unique IDs.
However, when you import a visualization into a different catalog, it is assigned a new ID, but when you import a dashboard into that same catalog, the referenced IDs are left unchanged. This means that an imported dashboard still refers to its visualization components using IDs from the old catalog, which do not match any visualization components in the new catalog.
Resolving The Problem
APAR LI81366 has been raised for this issue. This APAR has been closed as a permanent restriction, workaround is documented here.
WORKAROUND
We need to update the references to the visualize components in the exported dashboard JSON to reference the new IDs of these components in their new catalog.
In the following steps, the source catalog is where you're exporting dashboards and visualizations from, and the destination catalog is where you're importing them into. We assume both catalogs exist within the same Provider Organization.
In API Manager:
- Go to the source catalog’s “Visualize” page (Manage Catalogs > Source Catalog > Analytics > Visualize).
Note: In V2018, “Analytics” is in the left menu, while in V10, there’s an “Analytics” tab at the top of the page. - Export all visualizations in the source catalog that are used by the dashboards you want to export (you might want to give these JSON files appropriate names to keep track of them).
Do not export visualizations tagged “ADMIN”. They exist in all catalogs so there’s no need to export/import them. - Go to the source catalog’s “Dashboard” page (click the “Dashboard” tab).
- Export the dashboards from the source catalog you want to import into the destination catalog (you might want to give these JSON files appropriate names to keep track of them). Export each dashboard individually and not by checking multiple to make them easier to edit in later steps.
Do not export dashboards tagged “ADMIN”. They exist in all catalogs so there’s no need to export/import them. - Go to the destination catalog page (Manage Catalogs > Destination Catalog).
Look at the page’s URL. It will be similar to this:
https://apimanager.ibm.com/manager/porg/manage/catalog/<catalog-id>/products/
From this URL, make a note of the value represented as <catalog-id>. This value is the destination catalog’s ID. - For each exported visualization, open up the corresponding JSON file. It contains a key called “catalog_id” for each visualization, followed by a value that represents the ID of the source catalog:
"catalog_id": "<catalog-id-value>"
Replace <catalog-id-value> with the destination catalog’s ID you copied in step 5 for all instances and save the files. - Repeat step 6 for the exported dashboards JSON files, again replacing the “catalog_id” value with the destination catalog’s ID and save the files.
- Go to the destination catalog’s “Analytics” page (Manage Catalogs > Destination Catalog > Analytics).
Note: In V2018, “Analytics” is in the left menu. In V10, there’s an “Analytics” tab at the top of the page. - Click the “Visualize” tab at the top of the page and import all visualizations you edited in step 6.
- The visualizations are now imported into the destination catalog. They will all have been given a new ID.
- We now need to replace the visualization IDs in the exported dashboards with these new IDs.
- Create the following table in your favorite text editor:
TABLE 1 Visualization ID - Create a dashboard in the destination catalog and add all the visualizations you imported in step 9 to this dashboard. Each time you add a visualization to this dashboard, add its title to the “Visualization” column in the table you created in step 12, keeping the ID section blank for now.
- Save this dashboard with a title of “temp dashboard”.
- Export “temp dashboard" and open the JSON file that was created. Within this file is a key called “panelsJSON” followed by a long value containing multiple IDs (see figure 1 below). The IDs here reference the visualizations you added to the dashboard going from left to right and top to bottom. The information around the IDs describes the placement and size of the visualization component on the dashboard, but we don't need that information for now. Use the ID values in the order they appear in the exported dashboard JSON to populate the table you created in step 10. With the first ID going in the first row of your table, the second ID in the second row etc. Use figure 1 below to guide you.
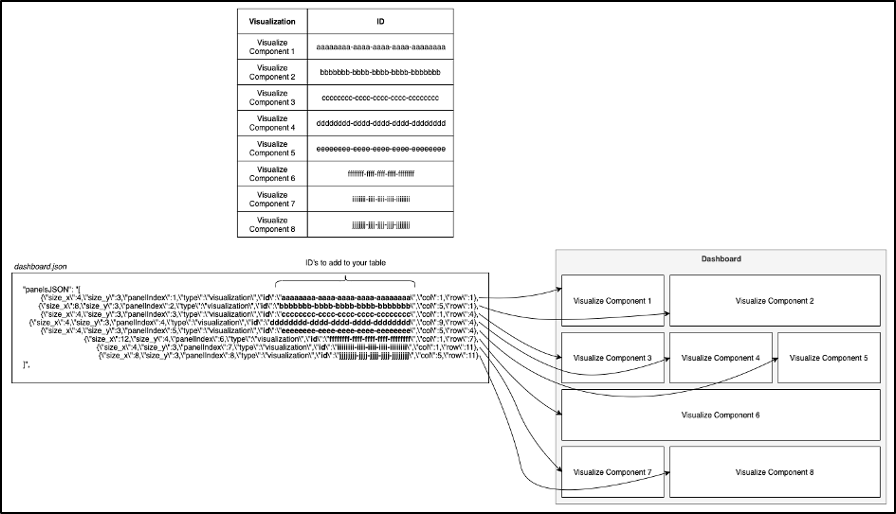
FIGURE 1 - You now have all of the IDs for your visualizations in the destination catalog. We now need to go through each exported dashboard and update the IDs of the referenced visualizations to reflect these new IDs (steps 17-20).
- Open an exported dashboard JSON file.
- In that file is a key called “panelsJSON” followed by a long value containing multiple IDs (alongside other information) similar to the one you saw for the "test dashboard". These represent the individual visualizations present in the dashboard in the order they appear (that is, from left to right, top to bottom). In order for the visualizations to appear correctly, the old visualization IDs need to be replaced with the new IDs that match with the visualization components as written in your table from step 12.
For example, if you had a dashboard containing six visualization components (for example, using components shown in figure 2), the value next to “panelsJSON” would have six IDs. The order of the IDs represents the order the visualizations are shown on the dashboard, from left to right, top to bottom. Thus, for the dashboard shown in figure 2, this would be 1, 5, 2, 6, 8 and 7.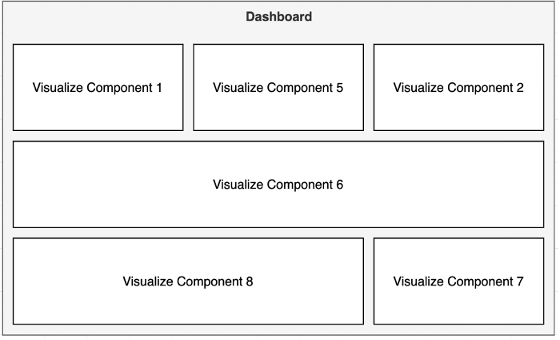
FIGURE 2 - Now you need to replace the IDs for the visualization components within the "panelsJSON" value with their corresponding new ID from the table you created in step 12:
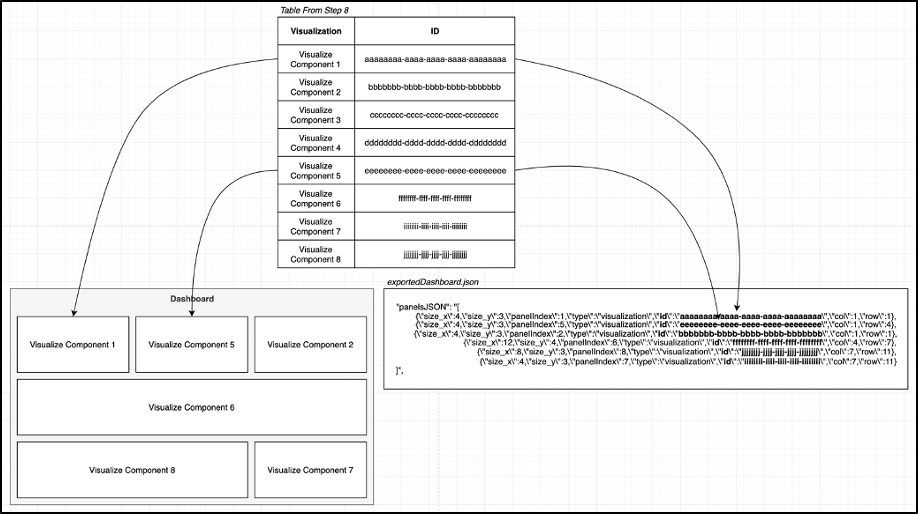
FIGURE 3 - Save the file and import this dashboard into the destination catalog.
- Repeat steps 17 - 20 for each of the remaining dashboards.
- Delete the "temp dashboard" dashboard as it is no longer needed.
- The dashboards will now work in the destination catalog.
Document Location
Worldwide
[{"Line of Business":{"code":"LOB45","label":"Automation"},"Business Unit":{"code":"BU053","label":"Cloud & Data Platform"},"Product":{"code":"SSMNED","label":"IBM API Connect"},"ARM Category":[{"code":"a8m50000000CeBlAAK","label":"API Connect->Management and Monitoring (MM)->Analytics"}],"ARM Case Number":"TS003359214","Platform":[{"code":"PF025","label":"Platform Independent"}],"Version":"10.0.0;2018.4.1.0"}]
Historical Number
TS003359214
LI81366
Product Synonym
APIC
Was this topic helpful?
Document Information
Modified date:
18 December 2020
UID
ibm16386320