General Page
|
Overview
|
Below is a consolidated collection of our most critical recommendations focused on peak workload performance and stability. This document, along with the ongoing webinar series, provides insight into our proven best practices around customization patterns, configurations, testing, and ongoing housekeeping. As with all recommendations, be sure to test these out in a non-production environment to validate and tune to your specific environments and use cases.
|
Application Performance
|
API Performance
- Validate API input before calling API, ensure required or filtrable attributes are passed (avoid open ended SQL.
- Limit the input size, and use optimal API output template to limit unnecessary data reads.
- Restrict output by setting the MaximumRecords in the inputs to any list API calls; use pagination.
- Tune servlet.token.absolute.timeout properties to prevent YFS_USER_ ACTIVITY locking under heavy load. Read more →
- Use appropriate SelectMethod method NO_LOCK, NO_WAIT, WAIT, and timeout properties QueryTimeout="3" TimeoutLockedUpdates="Y" for getter API’s
- Database Timeout properties for agent, integration, and UI: yfs.agentserver.queryTimeout, yfs.ui.queryTimeout
- Keep transaction boundary small when using update/modify API, this will ensure DB object (row) is locked for minimum duration.
- Use appropriate connect and read timeout for external calls, preferably less than 5 seconds, and make use of connection pool (cached/persistent connection, keep-alive).
- Remove always on DEBUG or SystemOut statements
- Eliminate frequent SELECT by enabling entity cache, at the same time make sure to redundant cache (always miss or frequently evicted)
- Avoid using current timestamp value as part of query predicate (this makes caching redundant due to unique value)
- Avoid the use of multiApi to process bulk transaction synchronously, instead use asynchronous requests (via JMS to drop message on queue and process using integration server)
Agent/Integration Servers (Orders, Payments, etc)
|
Order Flow
|
- Apply recommended JMS performance properties (See Integration > JMS Performance section)
- Review order and shipment monitors for redundancy, review and remove obsolete monitor rules.
- Have clear understanding of order ON_CHANGE or ON_SUCCESS events, make sure they are not excessive, and also validate for recursion.
- Excessively deep or infinite recursion can lead to java.lang.StackOverflowError exception and will halt JVM.
- Avoid reprocessing of order once condition evaluates to false. Read more yfs.yfs.monitor.stopprocessing.ifcondition.eval.false=Y
- Tune next task queue interval of "Process order hold type" agent from 15 minutes to the customized value yfs.omp.holdtype.reprocess.interval.delayminutes
- Have dedicated schedule order server to process backorders using OrderFilter= N|B agent criteria flag.
- Separate out the processing of orders by one of the attributes (ex. Large order, etc) with workload separation feature. Read more →
- Apply and Tune OMoC default HOTSku and OLA configuration. Read more →
- Enable Capacity cache and tune node locking properties based on business use case. Read more →
- Apply sourcing optimization (reduce DG size)
- When using YFSGetAvailabilityCorrectionsForItemListUE, make sure output of the UE excludes the items with ZERO supply quantity before passing the result to OOB API.
- Apply solver/sourcing interrupt properties to prevent runaway transactions within schedule agent.
- If capacity is enabled, then make sure to double check the calendar setting (store hours, etc.) for peak.
- Control/Throttle use of createInventoryActivityList API when using capacity filled event.
|
Payment Server
|
- Avoid redundant processing of the payment transaction, mainly Payment Collection, and Payment Execution Agent.
- Manually check YFS_CHARGE_TRANSACTION table for any order(s) having high number of records.
- SQL: SELECT ORDER_HEADER_KEY, COUNT(*) FROM OMDB.YFS_CHARGE_TRANSACTION GROUP BY ORDER_HEADER_KEY HAVING COUNT(*) > 100 ORDER BY ORDER_HEADER_KEY DESC WITH UR
- Sample Payment Collection getJobs query: SELECT YFS_ORDER_HEADER.ORDER_HEADER_KEY, YFS_ORDER_HEADER.LOCKID FROM OMDB.YFS_ORDER_HEADER YFS_ORDER_HEADER WHERE (YFS_ORDER_HEADER.PAYMENT_STATUS IN ('AWAIT_PAY_INFO','AWAIT_AUTH','REQUESTED_AUTH','REQUEST_CHARGE','AUTHORIZED','INVOICED','PAID', 'RELEASE_HOLD', 'FAILED_AUTH', 'FAILED_CHARGE', 'VERFIFY', 'FAILED')) AND YFS_ORDER_HEADER.AUTHORIZATION_EXPIRATION_DATE <= SYSDATE AND YFS_ORDER_HEADER.DRAFT_ORDER_FLAG='N' AND YFS_ORDER_HEADER.ENTERPRISE_KEY IN (SELECT DISTINCT ENTERPRISE_KEY FROM OMDB.YFS_ORDER_HEADER) AND YFS_ORDER_HEADER.DOCUMENT_TYPE='0001' AND NOT EXISTS (SELECT 1 FROM OMDB.YFS_ORDER_HOLD_TYPE YFS_ORDER_HOLD_TYPE WHERE YFS_ORDER_HOLD_TYPE.ORDER_HEADER_KEY= YFS_ORDER_HEADER.ORDER_HEADER_KEY AND (YFS_ORDER_HOLD_TYPE.HOLD_TYPE IN ( SELECT DISTINCT HOLD_TYPE FROM OMDB.YFS_HOLD_TYPE WHERE DOCUMENT_TYPE = '0001' AND ORGANIZATION_CODE = 'DEFAULT' AND BASE_PROCESS_TYPE_KEY = 'ORDER_FULFILLMENT' AND ( HOLD_TYPE_KEY IN ( SELECT HOLD_TYPE_KEY FROM OMDB.YFS_HOLD_TYPE_TRAN WHERE TRANSACTION_ID = 'PAYMENT_COLLECTION' AND PURPOSE = 'PREVENT') )) AND YFS_ORDER_HOLD_TYPE.STATUS <'1300')) WITH UR;
- Sample Payment Execution getJobs query: SELECT ORDER_HEADER_KEY, COUNT(*) AS COUNT FROM OMDB.YFS_CHARGE_TRANSACTION WHERE ORDER_HEADER_KEY IN ( SELECT DISTINCT YFS_CHARGE_TRANSACTION.ORDER_HEADER_KEY FROM OMDB.YFS_CHARGE_TRANSACTION YFS_CHARGE_TRANSACTION , OMDB.YFS_ORDER_HEADER YFS_ORDER_HEADER WHERE YFS_CHARGE_TRANSACTION.STATUS = 'OPEN' AND ( YFS_CHARGE_TRANSACTION.CHARGE_TYPE IN ( 'AUTHORIZATION' , 'CHARGE' ) ) AND YFS_ORDER_HEADER.ORDER_HEADER_KEY = YFS_CHARGE_TRANSACTION.ORDER_HEADER_KEY AND YFS_ORDER_HEADER.PAYMENT_STATUS <> 'HOLD' AND YFS_ORDER_HEADER.DOCUMENT_TYPE = '0001' AND YFS_ORDER_HEADER.DRAFT_ORDER_FLAG = 'N' AND YFS_ORDER_HEADER.ENTERPRISE_KEY = 'DEFAULT' AND NOT EXISTS ( SELECT '1' FROM OMDB.YFS_ORDER_HOLD_TYPE YFS_ORDER_HOLD_TYPE WHERE YFS_ORDER_HOLD_TYPE.ORDER_HEADER_KEY= YFS_ORDER_HEADER.ORDER_HEADER_KEY AND ( YFS_ORDER_HOLD_TYPE.HOLD_TYPE IN ( SELECT HOLD_TYPE FROM OMDB.YFS_HOLD_TYPE WHERE DOCUMENT_TYPE = '0001' AND ORGANIZATION_CODE = 'DEFAULT' AND BASE_PROCESS_TYPE_KEY = 'ORDER_FULFILLMENT' AND ( HOLD_TYPE_KEY IN ( SELECT HOLD_TYPE_KEY FROM OMDB.YFS_HOLD_TYPE_TRAN WHERE TRANSACTION_ID = 'PAYMENT_EXECUTION' AND PURPOSE = 'PREVENT') )) ) AND YFS_ORDER_HOLD_TYPE.STATUS < '1300' ) AND ( ( YFS_CHARGE_TRANSACTION.USER_EXIT_STATUS <> 'ONLINE' ) OR ( YFS_CHARGE_TRANSACTION.CREATETS <= SYSDATE ))) GROUP BY ORDER_HEADER_KEY HAVING COUNT(*) > 2 ORDER BY COUNT DESC WITH UR;
-
Note: Make sure update ENTERPRISE_KEY and ORGANIZATION_CODE before executing the query.
-
- SQL: SELECT ORDER_HEADER_KEY, COUNT(*) FROM OMDB.YFS_CHARGE_TRANSACTION GROUP BY ORDER_HEADER_KEY HAVING COUNT(*) > 100 ORDER BY ORDER_HEADER_KEY DESC WITH UR
- Implement automatic hold on rouge orders
- Manually check YFS_CHARGE_TRANSACTION table for any order(s) having high number of records.
- The scheduling of order will fail if order isn’t marked authorized, as such Payment Collection becomes critical process in order processing pipeline.
- Excessive YFS_CHARGE_TRANSACTION records can cause DB contention.
- Ensure the following parameter is set to ensure PAYMENT_COLLECTION agent does not fail with java.lang.IllegalArgumentException: Comparison method violates its general contract! Read more →
- Do not call processOrderPayments as part of long transaction boundary. This API is intended for In-person scenarios e.g., carry lines.
- Note: This API cannot be used with any of the order modification APIs or any APIs that modify orders - either through events, multiApi calls or services.
- The requestCollection() API will be invoked in a new transaction boundary and with a special condition - each Charge and Authorization request created will have UserExitStatus set to "ONLINE". When requestCollection() is complete, it will return to processOrderPayments() and execute a commit in the new transaction boundary then close it. Thus, even if an error is thrown after this point, the database will not rollback the changes made by requestCollection(). See application Javadoc.
UI Performance (Web Store, Call Center, etc)
- Apply recommended configuration around API performance (see above)
- Run purges prior to peak to ensure transaction tables such as YFS_ORDER_RELEASE_STATUS, YFS_ORDER_HEADER, YFS_ORDER_LINE, YFS_SHIPMENT, etc are lightweight to ensure optimal performance of the getter APIs.
- Cache critical configuration data using entity cache: YFS_REGION, YFS_REGION_DETAIL, YFS_ATTR_ALLOWED_VALUES, YFS_ATTR_ALLOWED_VAL_LOCALE
- Add the following indices to enhance the performance of the Batch Pick. Read more →
- Index on the STORE_BATCH_KEY column of the YFS_SHIPMENT_LINE table.
- Index on the SHIPNODE_KEY and INCLUDED_IN_BATCH columns of the YFS_SHIPMENT table.
- Set the property yfs.applyChildContainerQueryOptimization=Y in DB properties to optimize the query on the shipment container table while fetching child containers.
- Execute closeManifest API asynchronously.
- Set polling interval of Store and Call Center dashboard widgets to avoid redundant calls.
- Execute GetStoreBatchList with optimum values for MaxNumberOfShipments, NoOfShipmentLinesForNewBatch
- Purge YFS_INBOX table, identify and address root cause of the exception, keep exception to minimal
Promising APIs (HOTSku, Capacity, Sourcing, etc.)
|
API Choice
|
- Use optimal API and output template (ATP vs. Promising API), query what’s needed:
- Promising APIs such as findInventory would evaluate procurements, optimizations (such as Cost, Date, etc.), Shipment transfers, constraints (such as Ship Complete, Ship Single Node, etc.).
- For Inventory check ATP APIs such as getATP, getAvailableInventory or getAvailablityCache can be used, these APIs will avoid promising optimizations.
- Implement short lived availability cache for product browsing pages.
- Use optimal sourcing & scheduling configuration:
- Adjust Lead Times days according to the business needed; this can significantly reduce unnecessary compute.
- Implement solver and interrupt properties depending on the workload. See Common Performance Properties section.
- The sourcing should be designed in a way that nodes which are likely to be selected as final solution are only supplied from sourcing to availability and scheduling.
- Having a smaller number of nodes in sourcing sequence by using region-based sourcing, proximity (i.e. with x miles), multiple sequence optimization can yield better performance.
- All nodes can be last in the sequence to ensure order is fulfilled.
- Smart sourcing be used with GIV-RTAM with node level monitoring to filter out nodes based on availability cache.
- Integrate with Sterling Intelligent Promising, it combines inventory and capacity visibility with sophisticated fulfillment decisioning to help retailers maximize inventory productivity, make reliable and accurate order promises, and optimize fulfillment decisions at scale
- If reservation node can be considered as final ship node, then it should be passed on order line. This avoids schedule order to consider sourcing again.
- Enable API interrupt properties to avoid runaway transactions
- When calling findInventory consider using MaximumRecords attribute, this takes positive integer used to determine the maximum number of possible solutions to find. Using MaximumRecords="1" can help improve the performance. By default 5 solutions are generated.
- Run Inventory purge
- Ensure performance testing reflects expected production usage such as inventory and capacity availability, distribution of orders between SFS, BOPIS, DC, etc.
|
Common Performance Properties
|
- Promising API Interrupt (This can be used for AppServer wherein costly findInventory can be terminated):
- yfs.IntruptAfterMinutesMode
- yfs.IntruptAfterMinutes
- yfs.IntruptModeForReadWrite
- Solver Interrupt:
- yfs.yfs.solver.WarningOrExitOnIntrupt
- yfs.yfs.solver.IntruptAfterMinutes
- yfs.yfs.solver.IntruptOnlyForRead
- Optimization:
- yfs.yfs.solver.MaxChoiceFailures
- Aggregate reservation calls to IV, this improves performance of reserveAvailableInventory API yfs.UseAggregatedReservationsForIV property to "Y".
|
Enable HOTSku & Optimistic Lock Avoidance (a.k.a. OLA) - Global Inventory Visibility (GIV)
|
- Periodically review INV_INVENTORY_ITEM_LOCK for items-node having low availability. The purpose for the lock record; valid values:
- 10 (Lock as Availability is now low)
- 11 (Use previous Hot SKU functionality).
- 20 Low availability when granular locking is enabled.
- 21 to tracking 0 availability with granular locking.
- Run Inventory purge to ensure INV_INVENTORY_ITEM_LOCK is purged.
- After enabling HOTSku properties, make sure that adjustInventory API input has UseHotSKUFeature=Y for logic to be used.
|
Capacity (Resource pool)
|
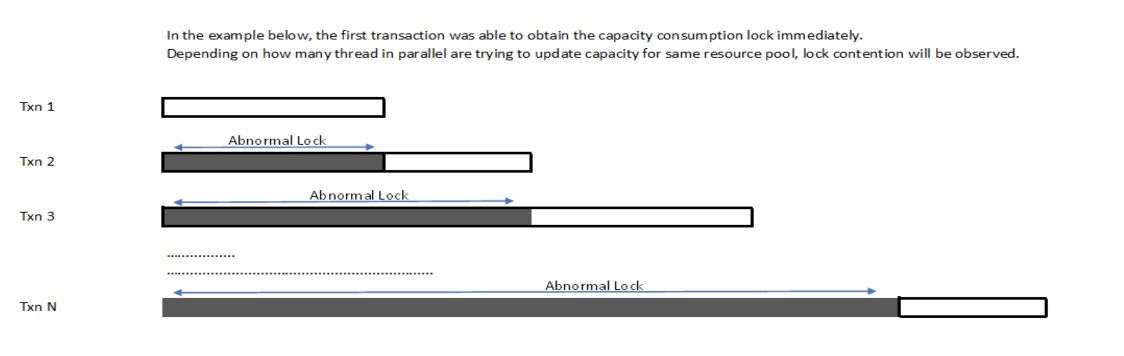
The capacity updates are triggered when Promising APIs are called in the update mode, such as reserveAvailableInventory and ScheduleOrder APIs. By default, the application updates capacity whenever a change is detected during order processing. When a capacity update is necessary, a lock is acquired for the resource pool consumption during calculation and released on the commit event of a transaction. This locking mechanism can lead to prolonged waiting times for other processes that also need to update capacity for the same resource pool.
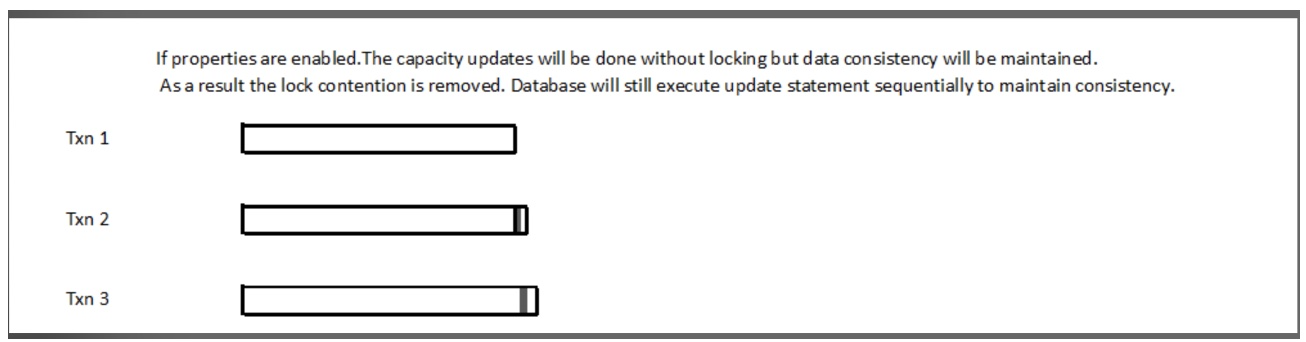
To improve capacity locking and reduce contention, configure the following properties.
-
yfs.persitCapacityAdjustments: Theyfs.persitCapacityAdjustmentsproperty controls whether capacity adjustments must be persisted immediately upon determination. By default, the value is set to false. When its set to true, the capacity updates are pushed to the end of the transaction that reduces the lock contention on the resource pool consumption table. -
yfs.capacity.useMassAdjustCapacityDriver: To further optimize the capacity updates, set the value of theyfs.capacity.useMassAdjustCapacityDriverproperty to true. The database updates for capacity consumption are pushed on the commit event of a transaction and reduce the lock contention on the YFS_RES_POOL_CAPCTY_CONSMPTN table. Ensure that you set the value of theyfs.persitCapacityAdjustmentsproperty to true.
By making these adjustments and configuring the recommended values, you can reduce capacity locking and improve the overall performance of processes that require capacity updates for the same resource pool.
Note: If you modify the default value of the yfs.persitCapacityAdjustments and yfs.capacity.useMassAdjustCapacityDriver properties, ensure that you restart the application and agent servers.
| Property Name | Default Value | Consideration(s) |
|
yfs.nodecapacity.ignoreCacheForLowAvailability If set to true, the application reads capacity from the database ignoring the cached availability if it is below the defined threshold. This property works in conjunction with the Node capacity locking properties. For more information see, Node capacity locking feature. |
Not Set |
Use this property if you are using capacity availability agent and running to over allocation. This property works based on yfs.nodecapacity.threshold value. This properties is applicable both to read and write APIs. Note: If yfs.capacityAvailablity.ignoreCacheForUpdateMode property is set, then by the update APIs. |
|
yfs.capacityAvailablity.ignoreCacheForUpdateMode
If set to true, promising APIs requiring capacity availability and intending to update, e.g. scheduleOrder API will read capacity from the database ignoring the cached availability. |
Not Set |
Reading from cache is faster; however, sometimes reading from cache can lead to some consumption. Having this property avoids contention under higher volume, and prevent over allocation. With this property enabled, update APIs such as reserveAvailableInventory will ignore cache, whereas read APIs like findInventory will read from cache. |
|
yfs.capacity.IgnoreCacheBelowThreshold
Ignores to load data from capacity cache, If dayCapacityPercentage lessthan the Threshold value. Setting this property to any Integer value(90) ignores reading from capacity cache if dayCapacityPercentage is lessthan Threshold value.
|
By default this is set to '0'. |
Reading from cache is faster; however, sometimes reading from cache can lead to some consumption. To takle this problem, this threshold based property has been introduced. With this property promising logic will dynamically calculate the threshold value based on the allocation (i.e. running average) and thread configuration. |
| yfs.nodecapacity.lock & yfs.nodecapacity.threshold
If node capacity is more than the defined threshold, locking is not performed for the inquired resource pool and date. If node capacity is less than the defined threshold, then future availability checks require locking before the checking availability. Read more → |
Not Set |
Resource pool locking property, it works with threshold. |
|
yfs.useNodeLocaleTimeForCapacityCheck
Set this property to consider a store locale for capacity consumption.
|
Not Set |
This isn’t a performance optimization; however, we have seen it come up when using store capacity. |
|
yfs.persitCapacityAdjustments (explained above)
|
Not Set |
Enable it, as explained earlier. |
|
yfs.capacity.useMassAdjustCapacityDriver (explained above)
|
Not Set |
Enable it, as explained earlier. |
- To disable node capacity do not adjust capacity to infinite.
- Use changeResourcePool API to disable capacity for specific resource pool, or DISABLE_NODE_CAPACITY_FOR_ENT.
- If capacity is set to 0, the capacity consumption record is deleted from the YFS_RES_POOL_CAPCTY_CONSMPTN table. Use capacity purge to delete the 0 capacity records
- Use Capacity Cache; The time-triggered agent pre calculates capacity and pre-populates YFS_CAPACITY_AVAILABILITY table
- Over allocation can be prevented using node locking yfs.nodecapacity.lock, yfs.nodecapacity.threshold properties.
|
Integration
|
JMS Performance
- Review MessageBufferPutTime relative to ExecuteMessageCreated statistic from YFS_STATISTICS_DETAIL table for any slowness
- Use non-persistent queues for internal agent queues
- User persistent queues for external integration or integration server processes.
- Avoid using message Selector, instead have dedicated internal/external queues
- Avoid longer transaction to prevent MQRC_BACKED_OUT error message
- Optimize output template to prevent MQRC_MSG_TOO_BIG_FOR_Q error while posting a message
- Use message compression when handling large inbound or outbound message. Read more →
- Note: IBM Sterling Order Management on Cloud allows 4 MB message size.
- Use message compression when handling large inbound or outbound message. Read more →
- Cache JMS bindings file (Specially if you serving the file from PV with slow I/O)
- yfs.jms.sender.alwayslookupqueue.disabled=true
- Enable JMS Session Pool
- yfs.yfs.jms.session.disable.pooling=N
- Enable multi-threaded PUT’s; Can help improve performance of RTAM server. Read More →
- yfs.yfs.jms.sender.multiThreaded=true
- Use anonymous reuse (requires JMS Session pooling to be enabled)
- yfs.jms.sender.anonymous.reuse=true
- Enable JMS connection retries. Read more →
- Retry Interval (milliseconds) 100 ms
- Number of Retries – at least 3 retries.
- Enable agent bulk sender properties to POST message in batches.
- yfs.agent.bulk.sender.enabled=Y|true
- yfs.agent.bulk.sender.batch.size=5000
External System
- Use connection pool (cached/persistent connection, keep-alive) with appropriate connect and read timeouts.
- Cache authentication token for reuse, regenerate upon expiry, or 401, 403 status codes. Read more →
- Adhere to best practice when invoking Inventory Visibility APIs. Read more for updated best practices →
- Use 100 item-node per payload when invoking APIs for multiple lines.
- Implement polling process to retrieve failed events. Read more →
- Space out the sync supply and snapshot calls, check with all stakeholders for ad-hoc execution or special requests during peak.
- Avoid redundant calls to generate snapshot
- Avoid redundant Network availability recomputes, consider following situations:
- Recompute Network Availability API recomputes availability for existing DG.
- Update DG API will recompute availability for newly created or modified DGs but not for existing DG.
- Bulk update to turning on/off existing nodes.
- Note: This requirement to turn of fulfillment by type can be achieved by frontend feature flag.
- Make sure to review release notes and API documents.
- Timely refactor the logic to avoid running into unforeseen risks of using deprecated or discontinued APIs. Read more →
- Upgrade to V2 APIs for IBM Sterling Intelligent Promising. Read more →
|
Database
|
Database Performance
- Enabling property yfs.yfs.app.identifyconnection=Y to identify the source of DB query / connection.
- Enable and optimize entity cache.
- DB2: Enable stmt_conc (LITERALS)*
- Oracle: Avoid full table scan with ConsiderOracleDateTimeAsTimeStamp attribute when using Oracle database. Read more →
- Monitor the frequently invalidated table caches and disable them if needed
- Avoid Blank queries, one of the common use case when non optimal API input is passed in. Ensure APIs are invoked with key filtering attributes.
- Make sure SQLs aren’t formed with unique values at runtime, it impacts the cache reusability.
- Enable application performance features and properties required for concurrent workload to avoid DB contentions (HOTSku, Capacity, etc.)
- Watch for YFS_PERSON_INFO query; apply index if needed. Read more →
- Check for duplicate records in YFS_PERSON_INFO table.
- Disable unnecessary transaction (entity) audits (Order Audits, General Audits, etc.)
- Disable resource intensive database maintenance during peak period (such as REORGs & RUNSTAT)
- Tune / Avoid ad-hoc queries used for reporting purpose, if possible, use standby or replica instances to query.
- Monitor database for long queriers and queries in lock-wait, and transaction logs usage.
Database Hygiene
- Maintaining healthy database can prevent disruption in production.
- Reduce the IBM Sterling Order Management database size with entity level compression and enhanced purges. More details →
- Accumulation of transactional data over long periods of time (and failure to purge as possible), may degraded query performance. Ensure all necessary purges are running to maintain healthy & lightweight database, which in-turn minimizes performance issues.
|
Platform (Server Profile, Certified Containers)
|
Server Profile (JVM/Pod specification)
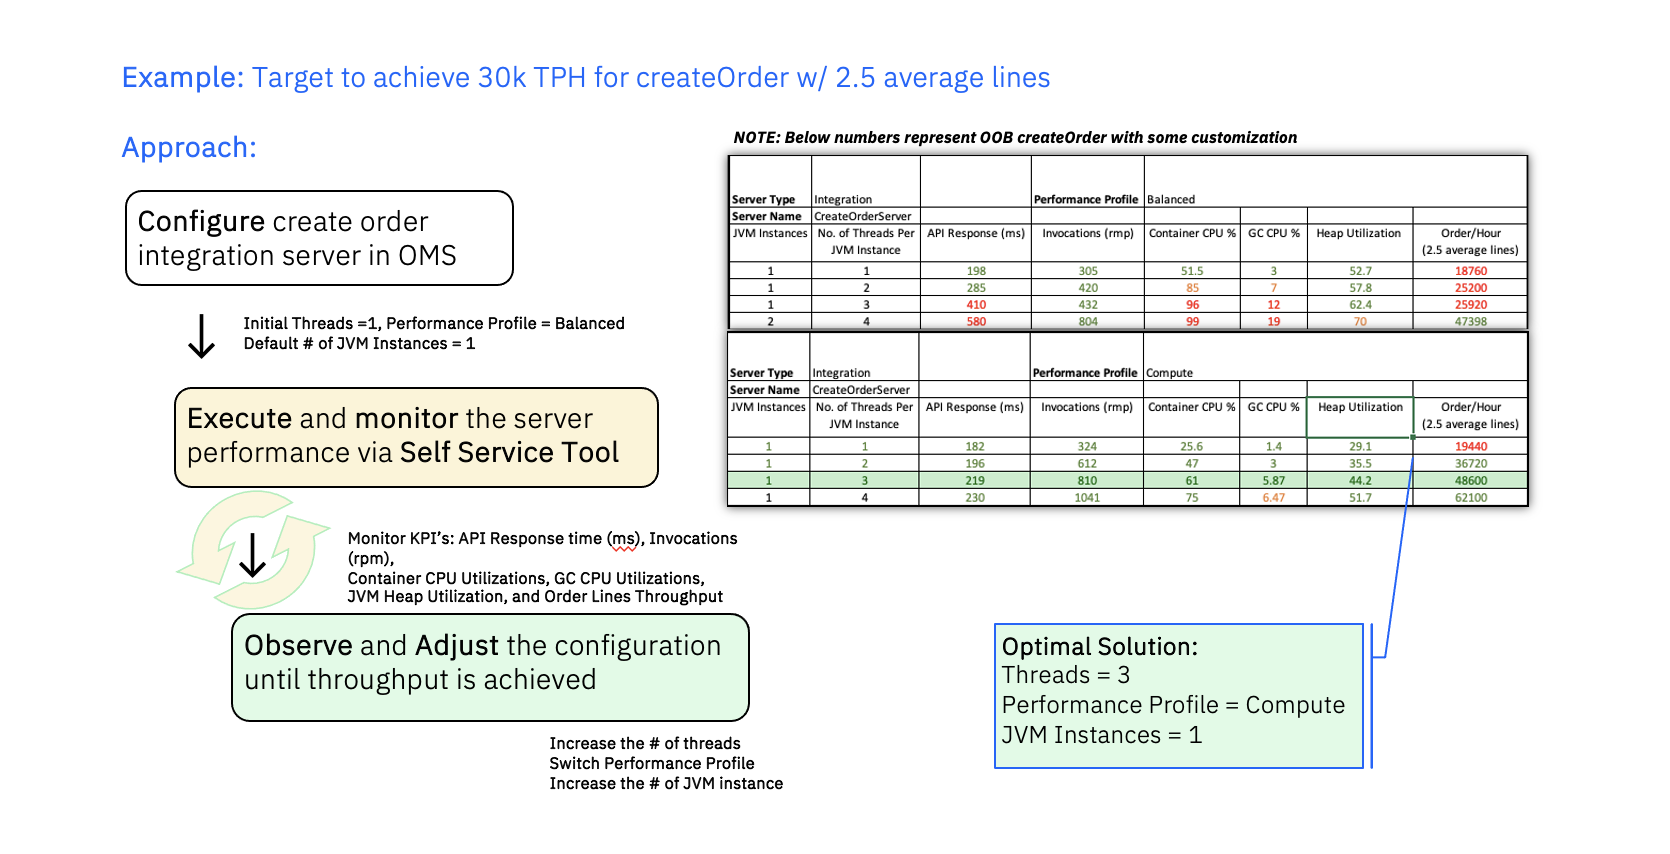
There are three server performance profiles for the agent or integration server.
For Example: The Memory/Compute profile is suitable for the servers/processes working with large dataset (large XMLs) within single transaction boundary. RTAM server is good example of it, because the transaction could be processing n number of inventory activities within single transaction.
There is no definite formula to identify the right profile. However, you can use the following guidelines to select a performance profile for optimal results.
- Start with a single thread for the server, single instance of the server, and the Balanced profile.
- Increase the number of threads gradually to arrive at the correct profile and maximum number of threads per server.
- If CPU or memory allocation does not change significantly with each additional thread, continue with the Balanced performance profile. Servers that spend most of the time calling external services display this kind of resource use pattern.
- If the JVM heap utilization stays around 80% or increases significantly with each additional thread, change the profile to Memory.
- With any of the performance profiles, if the CPU allocation stays around 70% or memory allocation stays around 80%, you might scale the server (Pod) rather than increase the number of threads.
- Spawning additional (untuned) instances of agent to try and improve throughput can lead to exhaustion of resource allocation available, my stress the system, and it can have cascading impact to other transactions.
- Community article on Sterling OMS Performance Profiles
Certified Containers
- Review CPU and memory resource requests and limits, define optimal profiles, and agent & integration threads.
                serverProfiles:
                - name: "profile-name"
                  resources:
                    limits:
                      cpu: millicores
                      memory: bytes
                    requests:
                      cpu: millicores
                      memory:    bytes
                ...
                - name: agents-huge
                  profile: ProfileHuge
                  property:
                    customerOverrides: AgentProperties
                    envVars: EnvironmentVariables
                    jvmArgs: BaseJVMArgs
                  replicaCount: 1
                  agentServer:
                    names:[ScheduleLargeServer,ReleaseLargeOrderServer]
- Watch for CPU throttling.
- Adjust Default Executor Threads, Data source pool size according to serverProfile you have defined for the Application Server.
- Separate traffic using
            appServer:
              ingress:
                contextRoots: [smcfs, sbc, sma, wsc, isf]
- Leverage Pod/Cluster Autoscalers. Read more on Configuring
horizontalPodAutoscalersparameter → - Network monitoring, latency to Database and JMS server; have network utility to validate the connections.
- Understand & Tune Ingress/Egress request/response limits
- Consume latest, keep the environment to up to date.
- Avoid automatic operator updates for production.
- Review and be prepared to captured diagnostics as per the Mustgather. IBM Order Management Software Certified Containers: Performance Issues →
- Check for SSL certificate validity for all internal and external communications.
- Monitor NFS IOPS for shared mounts used to store certs, catalog index, etc.
- Reduce redundant RMI calls; verify host ulimits (Open File/Socket)
Recommendations:
- Spawning additional (untuned) instances of agent to try and improve throughput can lead to exhaustion of resource allocation available, my stress the system, and it can have cascading impact to other transactions.
- Do not solely rely on pod autoscaler, make sure to performance test for expected workload and scale replica's accordingly.
|
Performance Testing Guidance
|
Overview
To best position for success on the OMS platform, it is important to understand how your application handles various scenarios known to challenges performance or stability. Testing in pre-production with data/workloads representative of production enables ability identify and address issues without impact to production business and operations. Performance testing is an art, but a mandatory one! It is imperative to vet out issues in advance on pre-production load testing, rather than wait for it to surface as a business-critical production issue!
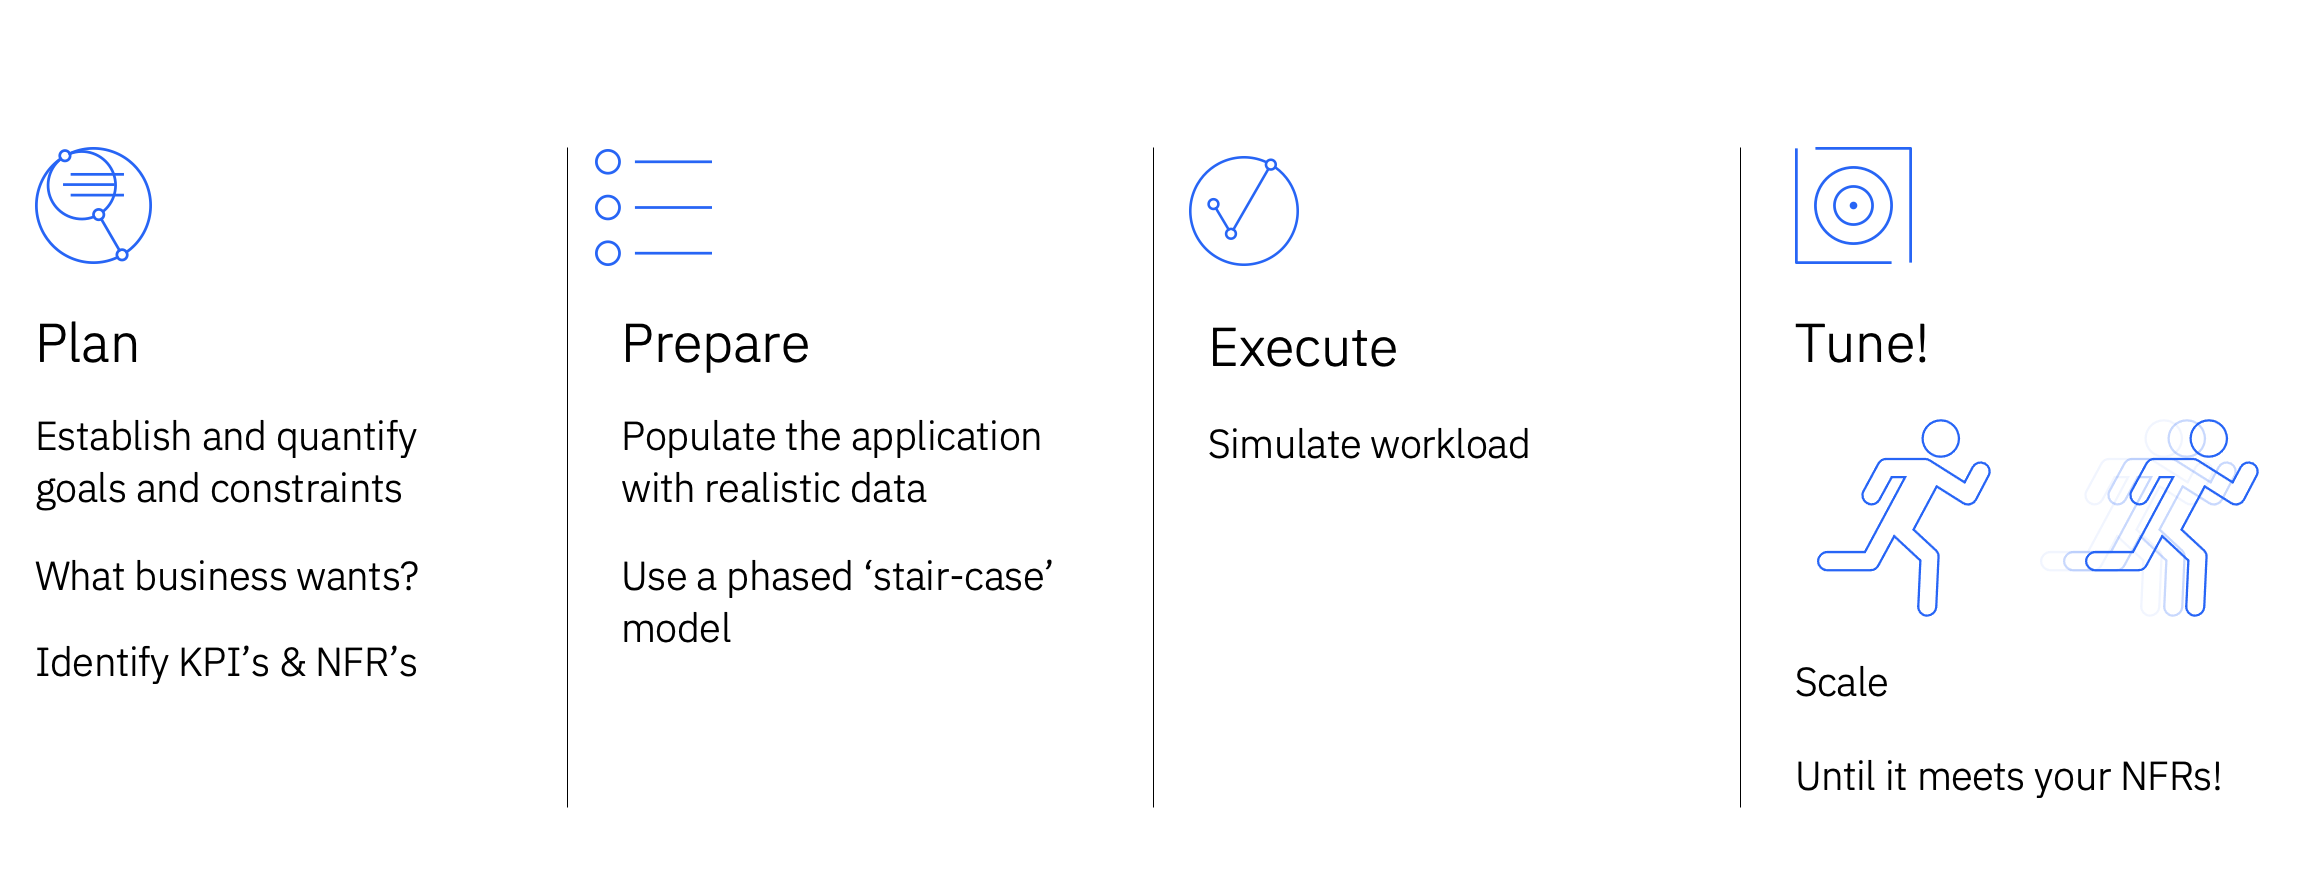
Best Practices
- Projected peak volumes – Ensure business and IT are in sync on expected peak loads to ensure planned tests are accurate.
- Representative Combination Tests – Assemble components to reflect real time DATA, scenarios and run in parallel to ensure adherence with NFR; Stage data for various components and run them under full load (ie. Create + Schedule + Release+ Create Shipment + Confirm Shipment + Inventory Snapshot (IV) )
- Ensure inventory picture (supply), node capacity (resource pool), distribution groups, and nodes setup reflect production state.
- Do not use same PI data, as it can lead to unexpected contention. In production PI data is unique.
- Agent and integration servers – ensure asynchronous batch processing components are tested in isolation and in combination with broader workload; ensure to tune agents and integration server (profile, threads) to meet expected peak SLAs/NFRs on throughput
- Test Failure Scenarios – validate resiliency of overall system and operations, ensuring graceful recovery if front-end channel (web, mobile, Call Center, Store, EDI, JMS), backend OMS, or external integration endpoints fail. Include ‘kill switches’ in any components that can be disabled to avoid magnifying an isolated issue into system wide one, especially for any synchronous calls.
- Confirm Peak days and Hours - Share any specific key dates or max burst times with IBM Support, including code freezes, flash sales.
Note: Refer to Knowledge Center for detailed Tuning and performance guidance.
|
Monitoring
|
Common Alerts
- Availability Check (Ping, Scripted Browser, API Test)
- Golden signals (Throughput, Latency, Error Rate, Saturation)
- Agent/Integration Server JVM Health (GC & Heap Utilization)
- Application Server JVM Health (GC, Heap, Default Executor Threads)
- Container workload (Pod) (CPU throttling, availability of desired number of Pods, frequent restarts, etc.)
- Application Statistics: YFS_STATISTICS_DETAIL
- Queries in Lock-Wait
- Long Running Query
- Transaction Log
- Tablespace
- HADR log replay (replication lag monitoring)
- Queue depth
- Message delay or equivalent queueing/dequeuing rate for all JMS queues.
- Local, NFS Disk Utilization
- VM (host) not responding
- CPU, Memory, Disk Usage
- CPU Steal
- Open Sockets (ulimit)
- Up/Down stream latency
- Number of Queued Requests
- Average Queue Time
- Active Session
- Bytes Received/Sent Per Second
|
Events
|
|---|
|
Upcoming:
TBD →
Events 2024:
Events 2023: |
Note: Please make sure to validate any of the described configuration change(s) in lower environment(s) before promoting to the production.
General IBM Support hints and tips
- Performance tuning (OnPrem) - Information on provisioning sufficient software resources and careful consideration to configuration settings to help achieve performance objectives on Sterling Order Management OnPrem environments
- Performance checklist - Overall list of performance recommendations
- Performance tuning (SaaS) - Information on provisioning sufficient software resources and careful consideration to configuration settings to help achieve performance objectives on Sterling Order Management SaaS environments
- IBM Order Management: Holiday Readiness Series - links to the IBM OMS Holiday readiness webcasts and information
My Notifications - Sign up for My Notification to receive a customized weekly email from IBM support for your Product. Learn about announcements and important technical support information. - IBM Support Portal - IBM Support Portal home page.
- IBM Support Guide - A guide to best practices and procedures when working with IBM Support for each type of product.
- IBM Directory of worldwide contacts - IBM Support worldwide Contacts.
- How to create and manage Enhancement Requests - Submit or vote for a product requirement.
Was this topic helpful?
Document Information
Modified date:
05 February 2025
UID
ibm17112352