Troubleshooting
Problem
IBM® Security Verify Information Queue, which uses the acronym “ISIQ”, is a cross-product integrator that leverages Kafka technology and a publish/subscribe model to integrate data between IBM Security products.
This Troubleshooting Guide helps administrators diagnose and resolve problems.
© Copyright IBM Corporation 2019-2024
ISIQ Overview
Before we delve into specific ISIQ troubleshooting scenarios, it’s useful to have an overview of the product and its various components:
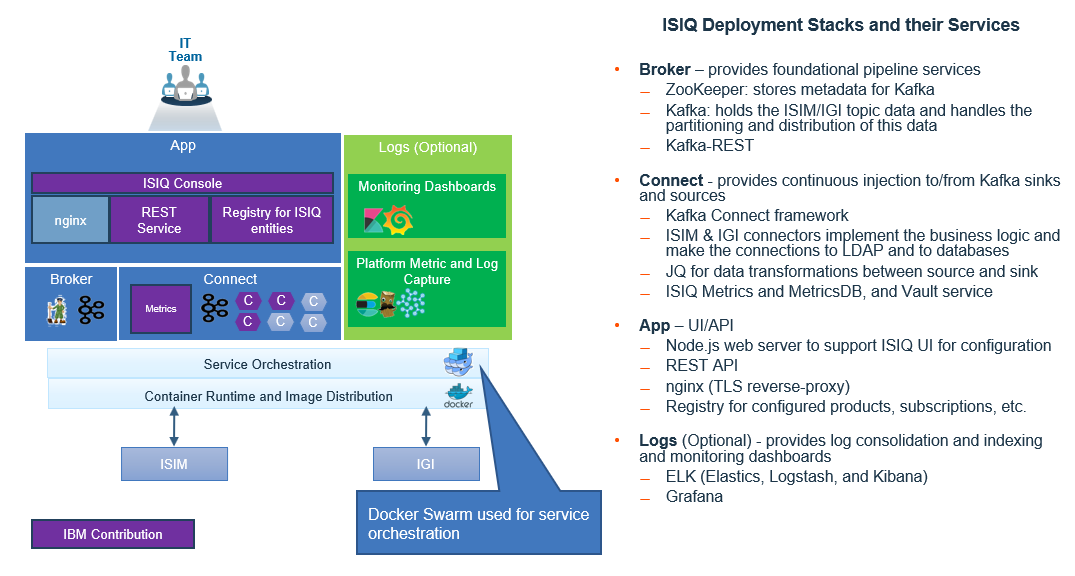
At the base of ISIQ is the ZooKeeper service in the Broker stack. Although ZooKeeper’s purpose is limited to storing metadata for Kafka, ZooKeeper must start or nothing else in ISIQ will work. ZooKeeper startup problems are rare, but if an error occurs in its data volumes (zookeeper_isiq_zdatalog and zookeeper_isiq_zdata), you can use the `docker volume prune --all` or `docker volume remove` commands to remove the volumes and start over. The volumes are re-created with what Kafka needs.
The Kafka service is a major part of the ISIQ solution:
- It holds the topic data for products such as IBM Identity Manager (previously known as IBM Security Identity Manager with the “ISIM” acronym) and Identity Security Verify Governance (referred to as “ISVG” but previously known as Identity Governance and Intelligence with the “IGI” acronym).
- It handles the partitioning and distribution of this data. The Kafka broker requires ZooKeeper to be available. The broker might fail to start if it senses an error in its data volume (broker_isiq_kdata) or if ZooKeeper cannot be reached. If the volume is bad, you need to either restore it from a backup, or reconfigure your ISIM and IGI products and let ISIQ reprocess the OUs, Services, Persons, Accounts, and so on, to bring everything back into sync.
The connect service in the Connect stack contains the ISIQ connector programs, which implement the data integration logic and make the connections to ISIM LDAP and to the various product databases. Most debugging situations involve the connect service, and thus the “connect_connect” docker log is usually the first log to examine when troubleshooting. The vault service manages the encryption and decryption of credentials needed to connect to your product data stores.
The metrics service in the Connect stack uses Burrow to retrieve consumer lag metrics from the Kafka broker. The service then pushes that data into the metricsDB (InfluxDB). The metricsDB also stores ISIQ’s alert information and topic message counts. ISIQ can continue doing its work of transferring data even if the metrics or metricsDB services are experiencing problems. If message counts are not being displayed in the ISIQ System Health dashboard, or if the lag graphs look incorrect, check for possible errors in the docker log for the metrics or metricsDB service.
For problems involving the ISIQ UI, which runs in the App stack, there are several places to examine. First, you can select the “Inspect” menu option in your browser to search for error messages in the “Console” tab. Next, you can review the app_nginx docker log. All accesses to ISIQ go through the nginx reverse-proxy service. For example, if logins are failing, the app_nginx log will include tracing of the attempt by the OIDC provider to connect to ISIQ. Finally, you can review the app_rest docker log. The app_rest service handles requests made from ISIQ’s UI to back-end services. If a product configuration error occurred, you should see information about a failing REST API call in the app_rest log.
Under certain conditions, an ISIQ connector can become unusable and stop producing or consuming data. This problem can occur, for example, if the password to access a data source changed but the ISIQ product configuration still contains the old value. The remedy is to update the configuration with the new password.
For problems such as product misconfiguration, the ISIQ-supplied connectors attempt where possible to remain in a RUNNING state instead of entering a FAILED state. The disadvantage of a connector entering a FAILED state is that it remains there until it is manually reset or its worker thread is restarted. By contrast, if the connector continued RUNNING, it can resume producing or consuming data once the configuration issue is fixed.
You can determine the status of a connector and its tasks on the ISIQ System Health page. In this screen capture, you see that all 10 tasks for the Prod_ISIM directory connector are running as expected.

But if you look at the System Health page and notice that one or more connector tasks are in a FAILED state, you need to delve deeper into the connector to troubleshoot the issue. A good approach is to query the problem connector through the REST interface of Kafka Connect. Here are the diagnostic steps to follow:
(1) Log in to the docker container of the connect service. It has image name “connect_connect”:
docker exec -it $(docker ps -q -f name=connect_connect) bash
Note: In a multi-node cluster, you must log in to the connect service on each node and perform these same steps.
(2) Retrieve the list of connectors in your ISIQ environment:
curl -X GET http://localhost:8083/connectors/
The curl GET output contains a list of zero or more active connectors, for example,
[
"userA.productB.connectorC",
"jsmith.MyISIM.directory"
]
(3) Check the status of a particular connector by appending its name and /status to the URL:
curl -X GET http://localhost:8083/connectors/userA.productB.connectorC/status
Here’s an illustration of what a working connector shows:
{
"name": "userA.productB.connectorC",
"connector": {
"state": "RUNNING",
"worker_id": "cad4b3fe3768:8083"
},
"tasks": [
{
"state": "RUNNING",
"id": 0,
"worker_id": "cad4b3fe3768:8083"
},
. . .
{
"state": "RUNNING",
"id": 9,
"worker_id": "cad4b3fe3768:8083"
}
]
}
Where tasks 0-9 all indicate a RUNNING state.
(4) Analyze the output from a problem connector by looking for errors returned from curl GET status:
curl -X GET http://localhost:8083/connectors/jsmith.MyISIM.directory/status
{
"name": "jsmith.MyISIM.directory",
"connector": {
"state": "RUNNING",
"worker_id": "bc454817a299:8083"
},
"tasks": [
{
"state": "FAILED",
"trace": "java.lang.RuntimeException: org.apache.directory.api.ldap.model.exception.LdapAuthenticationException: \n\tat com.ibm.kafka.connect.directory.util.RuntimeContext$3.make(RuntimeContext.java:100)\n\tat com.ibm.kafka.connect.directory.util.RuntimeContext$3.make(RuntimeContext.java:85)\n\tat com.ibm.kafka.connect.directory.util.Singleton.get(Singleton.java:13)\n\tat com.ibm.kafka.connect.directory.util.RuntimeContext.getSchemaManager(RuntimeContext.java:149)\n\tat com.ibm.kafka.connect.directory.util.RuntimeContext$4.make(RuntimeContext.java:110)\n\tat com.ibm.kafka.connect.directory.util.RuntimeContext$4.make(RuntimeContext.java:107)\n\tat com.ibm.kafka.connect.directory.util.Singleton.get(Singleton.java:13)\n\tat com.ibm.kafka.connect.directory.util.RuntimeContext.getDit(RuntimeContext.java:165)\n\tat com.ibm.kafka.connect.directory.source.DirectorySourceTask.query(DirectorySourceTask.java:136)\n\tat com.ibm.kafka.connect.directory.source.DirectorySourceTask.poll(DirectorySourceTask.java:111)\n\tat org.apache.kafka.connect.runtime.WorkerSourceTask.execute(WorkerSourceTask.java:163)\n\tat org.apache.kafka.connect.runtime.WorkerTask.doRun(WorkerTask.java:146)\n\tat org.apache.kafka.connect.runtime.WorkerTask.run(WorkerTask.java:190)\n\tat java.util.concurrent.Executors$RunnableAdapter.call(Executors.java:511)\n\tat java.util.concurrent.FutureTask.run(FutureTask.java:266)\n\tat java.util.concurrent.ThreadPoolExecutor.runWorker(ThreadPoolExecutor.java:1142)\n\tat java.util.concurrent.ThreadPoolExecutor$Worker.run(ThreadPoolExecutor.java:617)\n\tat java.lang.Thread.run(Thread.java:745)\n
Caused by: org.apache.directory.api.ldap.model.exception.LdapAuthenticationException: \n\tat org.apache.directory.api.ldap.model.message.ResultCodeEnum.processResponse(ResultCodeEnum.java:2028)\n\tat org.apache.directory.ldap.client.api.AbstractLdapConnection.bind(AbstractLdapConnection.java:132)\n\tat org.apache.directory.ldap.client.api.AbstractLdapConnection.bind(AbstractLdapConnection.java:114)\n\tat org.apache.directory.ldap.client.api.DefaultLdapConnectionFactory.bindConnection(DefaultLdapConnectionFactory.java:64)\n\tat org.apache.directory.ldap.client.api.DefaultLdapConnectionFactory.newLdapConnection(DefaultLdapConnectionFactory.java:107)\n\tat org.apache.directory.ldap.client.api.AbstractPoolableLdapConnectionFactory.makeObject(AbstractPoolableLdapConnectionFactory.java:113)\n\tat org.apache.directory.ldap.client.api.AbstractPoolableLdapConnectionFactory.makeObject(AbstractPoolableLdapConnectionFactory.java:38)\n\tat org.apache.commons.pool.impl.GenericObjectPool.borrowObject(GenericObjectPool.java:1188)\n\tat org.apache.directory.ldap.client.api.LdapConnectionPool.getConnection(LdapConnectionPool.java:123)\n\tat com.ibm.kafka.connect.directory.util.RuntimeContext$3.make(RuntimeContext.java:91)\n\t... 17 more\n",
"id": 0,
"worker_id": "bc454817a299:8083"
},
The MyISIM connector has an overall state of “RUNNING”, but each of its tasks (note: only the first one is shown here) has a “FAILED” state. As mentioned earlier, if a task is in a FAILED state, you must take corrective action because a FAILED task is unable to self-correct. Before you restart the task, find and fix the root cause to prevent the task from simply returning to a FAILED state. If you scan through the prior Java stack trace, you notice a key error:
Caused by: org.apache.directory.api.ldap.model.exception.LdapAuthenticationException
This error signifies that the connector supplied an incorrect user/password combination when it attempted to connect to the LDAP server for the IBM Security Identity Manager (ISIM). After you update the MyISIM configuration with the proper LDAP credentials, the tasks can be restarted so that ISIM data flows again through ISIQ.
(5) Restart a connector’s task by POST’ing a restart request to it:
curl -X POST http://localhost:8083/connectors/jsmith.MyISIM.directory/tasks/0/restart
. . .
curl -X POST http://localhost:8083/connectors/jsmith.MyISIM.directory/tasks/9/restart
This command must be repeated for every FAILED task. Since there are 10 tasks, 0-9 are restarted. After you enter these commands, check that the connector is back in good health:
curl -X GET http://localhost:8083/connectors/jsmith.MyISIM.directory/status
All MyISIM tasks should now be in a RUNNING state.
Note: As an alternative to POST’ing a restart via the command line, there is a GUI feature added in ISIQ 10.0.2 which simplifies the job. If you expand the product on the System Health dashboard, you will see a “Restart” link next to each failed task, for example,

After you research and fix the root cause of the failed task, click the “Restart” link. It performs the same action as if you had POST’ed a restart request to the task.
Updating a Subscription
Once a product is registered, ISIQ extracts, organizes, and publishes the product's data into topics and makes it available to consumers via the subscription process. In addition, ISIQ continues to monitor the product for data changes and ensures that topics are updated with those changes.
There might be cases, though, where entirely new types of source data are added to a product, and the existing subscription does not detect the new data and its corresponding topics. For instance, after you define service profiles or custom entities in IBM Security Identity Manager, you might find that the IBM Identity Governance and Intelligence (IGI), which subscribed to ISIM, is not consuming the new ISIM data sources.
To resolve the issue, you can delete and re-create subscriptions to that ISIM source. Navigate to the dashboard page of each subscribing product and choose "Delete" from the subscription menu. Then, click the '+' button to readd the subscription. The newly created subscription detects the new ISIM data sources and starts consuming them.
Alternatively, you can update an existing subscription by choosing the “Update subscription” menu option from the ISIQ product dashboard page. For more information, see the “Updating Subscriptions” Appendix in the ISIQ User’s Guide.
However, if you find that deleting and re-creating a subscription or clicking the “Update subscription” menu option still does not detect a new ISIM service profile that you imported after the subscription was created, you might need to restart the ISIM directory connector either by
- Restarting the ISIQ connect stack, or
- Updating your ISIM product configuration. Any change that you make to an ISIM product, even something as simple as editing the product’s “Description” field, causes the ISIM directory connector to be restarted. During the restart, it rereads all available ISIM service profiles. After the ISIM directory connector restarts, click the “Update subscription” button.
Replaying a Subscription
There might be circumstances in which you want to replay one of your ISIQ subscriptions and restart data integration from the beginning, for example, you're testing in a DevOps environment, or there was an unscheduled system outage and you're unsure about the subscription status in the aftermath.
In that scenario, you can reprocess source topics by using the “Reprocess” button listed with your subscription definition on the product dashboard page.

This button initiates a replay operation that reconsumes source topic data starting at offset 0. For more information, see the “Reprocessing Topics” section of the ISIQ User’s Guide.
If you reprocess a subscription’s source topics and it still doesn’t achieve the wanted result, you might consider reinitializing the ISIQ volumes by running the `docker volume prune --all` command. See the “Docker Cleanup” section of the ISIQ Deployment Guide for details.
WARNING: Pruning ISIQ volumes is not a decision to be taken lightly because it deletes all of your persistent ISIQ data, including product configurations, subscriptions, group membership, monitoring metrics, and audit history (note: it does NOT clear data on the product endpoints, for example, on IBM Security Identity Manager or Identity Security Verify Governance; that endpoint data must be cleared manually). If you have a production ISIQ and several subscriptions are working and only one is having problems, pruning ISIQ volumes is unwise since it disrupts other ongoing ISIQ usage. However, for test ISIQ environments, it might be less of a concern to reset everything back to an initial state if you don't have many configured products, or the ones you have are easily re-creatable.
Diagnosing ISIM-to-IGI Integration Problems
The next section, “Diagnosing IGI Event Failures and Messages”, examines issues that can arise with IGI rules and event flows when ISIQ is sending ISIM data. But first, let’s review the basic triage steps to follow when you’re diagnosing a problem in which ISIM entities are not being inserted into IGI.
Step-by-step triage
Suppose Person3 exists in ISIM but isn’t showing up as a user in IGI. Where should you begin?
(1) A good place to start is to search the relevant Kafka topics to determine whether Person3 was added in all the correct locations. Person3 should first appear in an ISIM source topic that has the naming format, <subscriberID>.<configurationName>.directory.Person. If Person3 is not in that topic, you should focus your troubleshooting efforts on how ISIQ is reading from your LDAP server. Review “Diagnosing LDAP Problems” later in this guide for recommendations.
Under the <starterKitDir>/util folder there are two scripts, topicList.sh and topicPoll.sh, to assist you in displaying topic data. The topicList.sh script lists the fully qualified name of every topic in the Kafka message broker. The first rows of the script output might look like this:

Assuming “isimDev” was the configured product name, you see an “isimDev.directory.Person” topic was created, which means ISIQ succeeded in reading at least one Person entity from ISIM’s LDAP.
The output from topicList.sh helps answer the question, “Do all of the expected ISIM source topics exist?” The ISIQ directory connector creates and loads a topic for every non-empty object profile found in LDAP. Compare the “directory.*” topics in the topicList.sh output against your knowledge of the profiles in LDAP. Are any topics missing? For example, if you have thousands of AD accounts in ISIM, but you don’t see a “directory. ADAccount” topic, it suggests that ISIQ was unable to complete its LDAP search and retrieval of AD accounts.
If the “directory.Person” topic exists, run topicPoll.sh to inspect the messages inside the topic. The syntax for running the script is: `topicPoll.sh <topic-name>`. The script output can be voluminous depending on how many entities of that type are defined in LDAP. In this screen capture, the output is piped to a grep command that searches for “Person3”.

The presence of Person3 in the topicPoll.sh output means that the directory connector was able to read and push Person3 into the “directory.Person” source topic. At this point, you’ve completed Step 1 of the triage process.
Note: When running topicPoll.sh, be careful to enter the topic name exactly as it appears in the topicList.sh output. If you mistype the topic name, the Kafka utility program, which runs in topicPoll.sh, will create an empty topic with the mistyped name. You can later delete these unwanted topics using the topicDelete.sh script.
(2) Once you locate Person3 in the ISIM source topic, search for Person3 in the corresponding IGI sink topic, which has the format, <subscriberID>.<igiConfigurationName>.IGI_database.USER_ERC. If there’s no such topic (according to output from topicList.sh), look for evidence of problems in the IGI sink connector. For example, there might be alerts on the ISIQ System Health dashboard indicating errors connecting to the IGI database.
You can also run `docker service logs -t connect_connect`. This command produces numerous log messages, but it is the best source of information about ISIQ connectors. You can pipe the output to a file for easier examination. The “-t” flag inserts a timestamp in each log message. Search for "ERROR" and "Exception" in the log in case there were connector failures. To enhance the value of the log, change CONNECT_LOG4J_ROOT_LOGLEVEL=INFO to CONNECT_LOG4J_ROOT_LOGLEVEL=DEBUG in the connect-stack.yml file. Although you shouldn’t run with DEBUG tracing on a long-term basis, it can be very helpful on a short-term basis when troubleshooting.
If you’re not able to find useful details in the connect_connect log, check the “isiq-failed-messages” topic. This topic doesn’t always exist, but for certain types of data integration problems, ISIQ writes information to it. If topicList.sh output includes isiq-failed-messages, run `topicPoll.sh isiq-failed-messages`. The command output might contain clues about a problem you’re investigating. After you finish examining isiq-failed-messages, you can delete it by running
<starterKitDir>/util/topicDelete.sh isiq-failed-messages
If more errors occur later on, the isiq-failed-messages topic is automatically re-created.
If the “IGI_database.USER_ERC” sink topic exists but you don’t see Person3 or other ISIM persons in it, or if Person3 exists in the topic but the fields associated with it are incorrect, there’s likely a problem in the ISIQ transformation layer that maps ISIM attributes to IGI attributes. In that case, check for recent changes in ISIQ’s /cfg/connect/txdef.json file that might be interfering with the mapping between a Person in ISIM and its representation in the USER_ERC topic.
Continuing this example, let’s suppose you find the USER_ERC topic in the topicList.sh output:

You then run topicPoll.sh to display the contents of the USER_ERC topic. Again, you grep for Person3 to filter the output:

If Person3 exists in USER_ERC and has the right fields associated with it, you can conclude that the transformation layer is working properly. At this point, you know that ISIQ successfully read from LDAP, loaded the data into an ISIM source topic, and copied and transformed the data into an IGI sink topic.
(3) The next step would be to ensure that a Person3 event was inserted into IGI’s Event “IN” queue and can be found in the appropriate Monitor tab under Access Governance Core (AGC). For every ISIM Person in LDAP, you should see an equivalent “Create User” event in Access Governance Core -> Monitor -> “IN – User events”, as shown here:

If you don’t find Person3 in the “IN – User events” tab, it’s likely a problem in the IGI sink connector, which is either unable to connect to the IGI database or is not authorized to insert records into the database. Again, the `docker service logs -t connect_connect` command output provides the most detailed information about a connector problem.
If other ISIM entity types are showing up in the AGC Monitor tabs, but Person types are not, look at IGI lag statistics. In the ISIQ System Health dashboard, expand the IGI product and review the “Current Lag by Topic” numbers. Is the lag count for USER_ERC much larger than it is for other topics? If you periodically check lag statistics over the course of several hours, does the USER_ERC lag count never decrease? To drill down on the IGI lag numbers, run the following command:
docker exec -it $(docker ps -f name=broker_kafka1 -q) bash kafka-consumer-groups --bootstrap-server localhost:9092 --list
Since you’re analyzing an ISIM-to-IGI integration problem, find the consumer group that ends with “IGI_database”.
If, for example, there’s a “connect-isiqTest.Zag.IGI_database” group, run the command:
kafka-consumer-groups --bootstrap-server localhost:9092 --verbose --describe --group connect-isiqTest.Zag.IGI_database | grep USER_ERC
The output from this command itemizes USER_ERC lag numbers by partition. Each Kafka partition runs in its own thread. In a single-node deployment with three partitions, the output might look like this (note: in a cluster there would be nine partitions):
connect-isiqTest.Zag.IGI_database isiqTest.Zag.IGI_database.USER_ERC 0 1 23 22 connector-consumer-isiqTest.Zag.IGI_database-0-6298e16c-76b2-4f04-bfec-623cb77f732f /10.0.52.13 connector-consumer-isiqTest.Zag.IGI_database-0
connect-isiqTest.Zag.IGI_database isiqTest.Zag.IGI_database.USER_ERC 2 2 16 14 connector-consumer-isiqTest.Zag.IGI_database-2-6fa55d98-9f0f-4dc0-91ef-b57b07cc0102 /10.0.52.13 connector-consumer-isiqTest.Zag.IGI_database-2
connect-isiqTest.Zag.IGI_database isiqTest.Zag.IGI_database.USER_ERC 1 2 15 13 connector-consumer-isiqTest.Zag.IGI_database-1-b99f67ca-c89c-48aa-ad13-bf088005c873 /10.0.52.13 connector-consumer-isiqTest.Zag.IGI_database-1
The full output includes column headers. The numbers in the middle are what you're interested in. They represent: PARTITION CURRENT_OFFSET LAST_OFFSET LAG
Check whether the lag is roughly the same across partitions (as it is in the sample output above). If one partition holds all the lag, it could mean there is problematic ISIM data which has caused the partition’s thread to get stuck. In situations like that, you will likely need to work with IBM Customer Support to analyze and resolve the issue. The best doc to collect is the kafka-consumer-groups command output as well as the connect_connect log with CONNECT_LOG4J_ROOT_LOGLEVEL=DEBUG specified.
Continuing the example, let’s suppose you find Person3 in “IN – User events”, but the status of the operation stays indefinitely as “Unprocessed”. That circumstance could mean a missing IGI rule. Review “Appendix A: IGI Customizations for ISIQ” in the ISIQ User’s Guide to ensure you’ve made all the required rule updates in Access Governance Core -> Configure -> Rules. A prolonged “Unprocessed” status might also mean:
- IGI has an incorrect time setting. Scroll to the right in the Monitor tab and look at the “Event date” and “Process date” columns. Are the date-time values in the future? If so, go to the IGI Virtual Appliance console and check Manage -> System Settings -> Date/Time to confirm you’ve properly set those values. The time zone must be the same on your IGI VA and data tier systems.
- IGI’s rule engine is inactive. Check the Task Planner -> Tasks tab to confirm that IGI’s rule engine-related tasks (the ones with an “Event” prefix) are active. If they are inactive, go to the Task Planner -> Settings -> Scheduler tab. Select the “Synchronize all” option from the Actions dropdown. Then, you should see that the rule engine-related tasks are active.
If the Person3 event was processed but has an “Error” status, go to the IGI Virtual Appliance console. In Configure -> Customer File Management -> log -> iga_core, search accessgovernancecore_event_in_log for possible errors in IGI's rule processing of new users. Errors in that log could also mean you should review Appendix A in the ISIQ User’s Guide to verify that IGI rule customizations were implemented.
In this manner, by systematically tracing the path of an ISIM entity from the LDAP directory to the ISIM source topic to the IGI sink topic to the IGI Event “IN” queue to the IGI rule engine and ultimately to the IGI database, you can pinpoint where in the ISIM-to-IGI data flow that a problem occurred.
Specific integration issues
Here are some tips for understanding and troubleshooting specific ISIM-to-IGI integration issues, as revealed by connect_connect log messages:
Account deferred because of a missing group
INFO [conn:116abfa7.IGI.IGI_database:Process Account:404] Deferring account CN=John Smith/OU=ABC/OU=123 with missing group, Queued accounts: 45 (com.ibm.kafka.connect.igi.IGISinkTask)
INFO [conn:116abfa7.IGI.IGI_database:Reprocessing:404] Reprocessed Accounts size start: 45 size end: 45 (com.ibm.kafka.connect.igi.IGISinkTask)
If you see repeated messages about deferring an account because of a missing group, it means that account data has come to the IGI sink connector, but the account cannot be added to the IGI database. The reason this account (and probably the other 44 accounts) is deferred is that John Smith is a member of an ISIM group which doesn’t exist in IGI. Either the group was deleted in ISIM but ISIM account objects still have a reference to it, or the group exists in ISIM but it hasn’t yet been integrated into IGI.
Since the IGI sink connector processes groups before accounts, if the group exists in ISIM, it should have already been added to IGI unless there was an error. With DEBUG logging enabled in the connect stack, try to locate in the connect_connect log the name of the group that’s missing in IGI. Otherwise, if there aren’t too many groups associated with the account, you can search for each one in the IGI UI and note down any that are missing. Once you’ve identified the missing group, run `topicPoll.sh isiq-failed-messages` and search for errors pertaining to that group.
Accounts of a particular type not being processed
Setting CONNECT_LOG4J_ROOT_LOGLEVEL=DEBUG provides sufficient detail in the connect_connect log to troubleshoot most integration problems. DEBUG logging is helpful when ISIQ finds an ISIM entity but is unable to integrate it into IGI. However, there’s a special type of problem in which no data of a particular type is found. For example, if you have many ISIM AD Accounts, but no ADAccount directory topic exists, the question is “Why?” and DEBUG logging might not include any messages pertaining to AD accounts since none were found or processed by ISIQ. In that circumstance, you should specify CONNECT_LOG4J_ROOT_LOGLEVEL=TRACE. It’s much more detailed than DEBUG logging and shows each LDAP query issued on each thread.
After setting TRACE-level logging and restarting ISIQ, it’s very important to wait only 5-10 minutes before collecting the connect_connect logs. That’s because TRACE-level logging is verbose. The connect_connect logs will fill rapidly. You need to give the connect stack enough time to run and reproduce the problem, but not too much time that the logs roll and the startup messages disappear. It's vital to see the startup sequence because that's where the TRACE log messages will show which thread was assigned to the ADAccount profile, and from there it’s possible to see what that thread is doing, whether it got stuck, encountered an error, etc.
Diagnosing IGI Event Failures and Messages
IGI includes predefined rule flows that are executed by its rule engine. The rule flows process events from different event queues in order to create, modify, and delete entities. ISIQ relies on the rule flows and event queues to push updates to IGI.
To help you diagnose cross-product integration problems where (a) events sent to IGI fail to be processed successfully, or (b) they’re processed successfully but with warning messages, here is a list of pertinent IGI rule flows, event queues, and diagnostic tips (note: to see rule flows in the IGI Administration Console, navigate to Access Governance Core -> Configure -> Rules):
Live Events -> IN -> ORGUNIT_ADD / ORGUNIT_MODIFY
These rule flows create or modify an organizational unit. When an event is added to the ORGANIZATIONAL_UNIT_ERC table, the ORGUNIT_ADD rule flows are executed by the IGI rule engine. When an existing entity in ORGANIZATIONAL_UNIT_ERC is modified, the ORGUNIT_MODIFY rule flows are executed.
Live Events -> IN -> USER_ADD / USER_MODIFY
These rule flows add or modify a user. When an event is added to the USER_ERC table, the USER_ADD rule flows are executed by the IGI rule engine. When an existing entry in USER_ERC is modified, the USER_MODIFY rule flows are executed.
Rule flows in Live Events -> TARGET
Rule flows that have the ROLE_ prefix are for creating, modifying, or deleting external roles or permissions. Similarly, rule flows that have the PERMISSION_ prefix affect permission or external role assignments, and rule flows that have the ACCOUNT_ prefix affect accounts.
Based on an event’s operation number in the EVENT_TARGET table, the IGI rule engine executes the corresponding rule flows to process the event:
- Operation number 9 – ACCOUNT_MODIFY rule flow is executed for modifying the account.
- Operation number 10 ACCOUNT_CREATE rule flow is executed for adding the account.
- Operation number 11 – ACCOUNT_REMOVE rule flow is executed for deleting the account.
- Operation number 1 PERMISSION_ADD rule flow is executed for adding the permission or external role to the user.
- Operation number 2 PERMISSION_REMOVE rule flow is executed for removing the permission or external role from the user.
- Operation number 25 – ROLE_CREATE rule flow is executed for adding or modifying the permission or external role.
- Operation number 26 – ROLE_REMOVE rule flow is executed for deleting the permission or external role.
- The “IN – User events” section has the user-related events.
- The “IN – Org. Unit events” section has the organizational unit-related events.
- The “TARGET inbound – Account events” section has the account and entitlement assignment-related events.
- The “TARGET inbound – Access events” section has the permission and external role-related events.
Here are the event statuses you might encounter in the Status column:
- Unprocessed – The event is waiting for the rule engine to process the corresponding rule flows.
- Success – The event was processed successfully.
- Error – The event was processed but failed with an error.
- Ignored – The event was processed but ignored, that is, it had no effect.
Create Account succeeds with “Unable to Match Identity” message
If a successful “Create Account” event in the “TARGET inbound – Account events” table displays an "Unable to Match Identity" message in the Trace column, be aware that:
- This informational message means that the account was created as an orphan account, which happens if an account is created before its account owner is created.
- This message is not an uncommon occurrence. ISIQ passes IBM Security Identity Manager entities to IGI on multiple parallel “pipes”. Therefore, IGI might receive and process an account creation event first, and flag it as an orphan with an “Unable to Match Identity” message, and then receive and process its associated user creation event shortly thereafter.
- After the account owner user is created in IGI, the orphan account will be assigned to the correct user.
- To check whether an orphan account was assigned to the user after the user was created, you can:
- Navigate to the AGC -> Manage -> Users -> Select a user -> Accounts tab. From here, you can view all the accounts that a user has.
- Navigate to the AGC -> Manage -> Account Configurations -> Select an account configuration -> Accounts tab. It shows all accounts in a specific account configuration.
Create Account fails with “OBJECT_NOT_UNIQUE -HRPlaceholderValues-” error
If you find that expected ISIM accounts are not being inserted by ISIQ into IGI, check the “TARGET inbound – Account events” section for any “Create Account” errors that occurred. There is a known IGI timing problem to be addressed in an upcoming fix pack, in which two events arrive for the same person at the same instant. It results in duplicate entries for that person in IGI’s HR_PHOLDER_VALUES table. As evidence of the problem, you see one or more entries in “TARGET inbound – Account events” that look like this:

The key indicator is “OBJECT_NOT_UNIQUE -HRPlaceholderValues-“ message in the Trace column.
Once a duplicate entry exists in HR_PHOLDER_VALUES, any subsequent account events for this person fail. The remedy is to remove the duplicate entry or entries (there can be more than one) by running the following SQL:
DELETE FROM igacore.HR_PHOLDER_VALUES
WHERE id IN (SELECT hrplaceholderid
FROM (SELECT person, max(id) hrplaceholderid
FROM igacore.HR_PHOLDER_VALUES
WHERE person IN (SELECT person
FROM igacore.HR_PHOLDER_VALUES
GROUP BY person
HAVING count > 1)
group by person));
You can then rerun the “Create Account” event that failed previously.
Rerunning failed events with IGI debugging
If you’re unclear why an event has an Error status, you can enable IGI debugging, rerun the event, and check the IGI log file to learn more about the cause of the failure. Some failed events also generate an error message in the Trace column that provides extra details about the problem.
To enable IGI debugging, you need to:
- Go to Access Governance Core > Settings -> Core Configurations.
- Set the Log Level to Debug and Save.
To rerun the failed event, you need to:
- Select the failed event.
- Select Actions > Re-Execute.
To view the IGI log file, you need to:
- Log in to the IGI Virtual Appliance Console.
- Select Configure > Custom File Management.
- Expand the log directory and select the iga_core directory.
- Download accessgovernancecore_event_in.log for the user and organizational unit events.
- Download accessgovernancecore_event_target.log for account and entitlement-related events.
- These log files have more information on why the event failed.
If the event failed due to incorrect logic from the corresponding rule flows, you need to examine and correct the rule flow and re-execute the failed event.
If the event failed due to a missing dependency, you can re-execute the failed event after the dependent entity is created. For example, if the “permission assignment” event was processed before the “permission add” event, the permission assignment event might fail. In that case, rerun the permission assignment event once the permission is created.
Diagnosing Connection Failures
If you’re troubleshooting a problem in which an ISIQ product is not producing or consuming data, check whether the product is able to connect to its data store. The root cause of many product registration and “missing data” problems is a connection failure.
Log messages produced by the connect service are one of the best sources of diagnostic data. When an ISIQ single-node swarm is running, the output from `docker service ls` looks something like this:
ID NAME MODE REPLICAS
jhmh0mtvyq42 app_nginx replicated 1/1
rb1ymv3e6ebt app_products replicated 1/1
vg4mlry7l04p app_redis replicated 1/1
f47nyejy3t53 app_rest replicated 1/1
bn4vplcxotfc app_web-app replicated 1/1
xq53gf7i3gzn broker_kafka1 replicated 1/1
wba0a5xe1006 broker_kafka-rest1 replicated 1/1
mj7czq9opwrc broker_zoo1 replicated 1/1
ib0moyrg5xp6 connect_connect replicated 1/1
k49tgqfp9cgs connect_metrics replicated 1/1
m8c2lt6s9cjh connect_metricsdb replicated 1/1
62gsnxna1a4y connect_vault replicated 1/1
The connect service’s image name is “connect_connect”. Therefore, to browse its log messages, run the command, `docker service logs -t connect_connect`. The resulting messages are referred to in this guide as the “connect_connect log”. Because the number of messages can be quite large, you might want to grep for particular strings, or pipe the output to a file, or tail the log (you can run `docker service logs -t connect_connect --tail nnn` to limit the output) to make it easier to find relevant data. You can greatly enhance the usefulness of the log by temporarily changing CONNECT_LOG4J_ROOT_LOGLEVEL=INFO to CONNECT_LOG4J_ROOT_LOGLEVEL=DEBUG in the connect-stack.yml file.
The following examples illustrate how the connect_connect log can help you:
(1) Suppose you configure ISIM product “isimA”, and you notice that 0 tasks are running. You grep for “ERROR” in the connect_connect log. The last 2 messages are:
[2021-07-23 22:49:54,842] ERROR unable to bind connection: Cannot connect to the server: Hostname 'sjisim6' could not be resolved.
(org.apache.directory.ldap.client.api.DefaultLdapConnectionFactory)
[2021-07-31 22:49:54,851] ERROR while starting connector sallyjones.isimA.directory (org.apache.kafka.connect.runtime.WorkerConnector)
Based on the “could not be resolved” message, check whether “sjisim6” is the correct hostname where LDAP is running, or if a domain suffix must be appended to “sjisim6” for DNS resolution, or if DNS is not available and you must specify “sjisim6” as a dotted decimal address. Once you figure out the hostname issue, select the “Edit” menu option from the isimA product dashboard page to fix the “Directory Source URL” parameter, and then see whether the isimA tasks start running.
(2) You configure IGI product “myIGI”, and again you notice that 0 tasks are running. Since the connect_connect log output can be voluminous, you grep for “myIGI” and “ERROR”:
[2021-07-24 20:28:06,217] ERROR while starting connector johnsmith.myIGI.IGI_database (org.apache.kafka.connect.runtime.WorkerConnector)
With this message, all you can infer is (a) there’s a potential problem in how the IGI database connection parameters were configured in ISIQ, or (b) the IGI database is unavailable and refusing connections. If you separately determine that the IGI DB is up and running, you would rule out (b).
The connect_connect log has more details about the failure, including a series of stack traces:
Unable to connect to database on attempt 1/5. Will retry in 10,000 ms. (com.ibm.kafka.connect.igi.util.DatabaseConnection) | com.ibm.db2.jcc.am.SqlInvalidAuthorizationSpecException: [jcc][t4][2013][11249][4.21.29] Connection authorization failure occurred. Reason: User ID or Password invalid. ERRORCODE=-4214, SQLSTATE=28000
This message clearly points to a misconfigured IGI Database User or Password, but in other problem scenarios you might see generic errors in the connect_connect log such as:
“com.ibm.db2.jcc.am.DisconnectNonTransientConnectionException” and “Connection refused. ERRORCODE=-4499, SQLSTATE=08001”.
Although this message indicates a database connection problem, you can’t yet isolate the source of the problem. In that case, double-check the accuracy of all IGI database settings configured in ISIQ. If you spot a discrepancy, select the “Edit” menu option from the myIGI product dashboard page to correct the settings so that the connection to the IGI database can succeed.
(3) You configure ISIM product “isiq-isim” and you see on the product dashboard that the ISIMSink tasks are not running:

You grep for “ERROR” and “Exception” in the connect_connect log and find these messages:
[2022-08-07 17:15:04,048] ERROR [conn:isiquser.isiq-isim.ISIMSink:Login:88] Failed to connect to ISIM server with base URL https://10.0.0.9:9082: 2 counts of InaccessibleWSDLException connect_connect.1.cc6utd8z3dit@isiqdemo.com | (com.ibm.kafka.connect.isimws.GenericClient)
connect_connect.1.cc6utd8z3dit@isiqdemo.com |
[2022-08-07 17:15:04,048] ERROR [conn:isiquser.isiq-isim.ISIMSink:Login:88] Stack Trace for com.ibm.kafka.connect.isimws.IsimWsException: 2 counts of InaccessibleWSDLException connect_connect.1.cc6utd8z3dit@isiqdemo.com | javax.net.ssl.SSLHandshakeException: No subject alternative names present
Since you configured your ISIM Web Services connection with an https:// URL, a valid certificate must exist between ISIQ and ISIM’s WebSphere. The final message, highlighted in red, tells you there’s a problem in the subject alternative name (SAN) field defined in the certificate. To resolve the problem, you must either (a) modify the certificate’s SAN field so that it matches the hostname you configured in the ISIQ WebServices URL, or (b) modify the ISIQ WebServices URL so that its hostname matches a SAN specified in the certificate.
(4) You configure ISIM product “ISIM_Prod” but see an alert on the ISIQ System Health dashboard:
Unable to connect to ISIM Server for product ISIM_Prod. Reason: org.apache.xerces.dom.AttrImpl
The only relevant ERROR messages in the connect_connect log essentially repeat what the System Health alert is reporting. You verify that the ISIM Web Services port is open and that the ISIQ host has network connectivity to it. You previously set up a certificate between ISIQ and ISIM's WebSphere.
In this scenario, you might want to look more closely at the SSL handshake between ISIQ and WebSphere to determine whether there is a TLS version mismatch or similar issue that is preventing the SSL connection. By default, the connect_connect log does not contain verbose logging of SSL handshakes. To add the extra logging, you must update connect-stack.yml, specifically, the KAFKA_HEAP_OPTS environment variable. Append after the -Xms256M -Xmx2G parameters the following debug parameter:
Djavax.net.debug=all:handshake:verbose
Restart ISIQ, review the SSL handshake messages in the connect_connect log to see whether there is a TLS issue which you can resolve. Remove the debug parameter from connect-stack.yml when it is no longer needed.
Diagnosing Cluster Setup Problems
When you first implement an ISIQ cluster, the most common problems you encounter involve networking between nodes in your swarm. The problems often show up at the application layer, such as an inability to log on, or an inability to create a product or subscription. But if you dig deeper, you discover the underlying problem is in the Kafka or ZooKeeper services where cluster networking activity occurs.
For example, suppose that you attempt to configure a product in the cluster, and the operation fails with a 504 error in the ISIQ UI. You observe the following messages in the app_products log:
WARN ClientUtils:54 - Removing server kafka1:9092 from bootstrap.servers as DNS resolution failed for kafka1
WARN ClientUtils:54 - Removing server kafka2:9092 from bootstrap.servers as DNS resolution failed for kafka2
WARN ClientUtils:54 - Removing server kafka3:9092 from bootstrap.servers as DNS resolution failed for kafka3
INFO RegistryMain:102 - Jetty Server and registry are shutdown.
These messages signify that no Kafka brokers are running in the cluster, likely due to an internal networking issue. To diagnose an issue of this sort, here are some things to check and guidelines to follow:
(1) What information does docker have about its network? Docker serves as its own DHCP server to ensure that all containers in a network have non-conflicting IP addresses. Docker also provides DNS services to map service names to IPs. On each node in the cluster, run the `docker network ls` command to see which networks are defined. Also, run `docker network inspect broker_default` to display data about the “broker_default” network. The output from these commands sheds light on your cluster’s network configuration, including which IP addresses docker assigned to each ISIQ container.
(2) Run `docker node ls` on the leader node (also known as the manager node). The output shows the nodes in your swarm. Do the names listed in the HOSTNAME column match what you expected? Do the STATUS and AVAILABILITY columns indicate that nodes are “Ready” and “Active”? To drill down on a particular node, run `docker node ps <hostname>`. It lists the running services on a node. The `docker node inspect <hostname>` command lists the attributes of a node, including its “Labels”, which confirms whether `docker node update --label-add isiq=xxxx <hostname>` commands were entered per Step 9 in the “Summary of Installation & Configuration Steps” in the ISIQ Deployment Guide.
(3) Are all of the broker containers running? Issue the `docker service ls` command on the leader node. Assuming you have a three-node cluster, do broker_kafka1, broker_kafka2, and broker_kafka3 display 1/1 or 0/1 in the REPLICAS column? If you issue multiple `docker service ls` commands, does the REPLICAS information fluctuate? In other words, do you sometimes see 0/1 or 1/1, or 0/3 or 3/3? If so, that means containers are repeatedly stopping and restarting.
(4) If the `isiq start` command fails to start one or more containers, examine the error messages output to the console. The messages can point to where the problem is. For example,
broker_zoo3.1 zookeeper:3.4.14@sha256:3882d9493d387ba77b7b69e2a031b9396477ec29483d51ceaed645c1389182e5 Running Pending about a minute ago "no suitable node (scheduling constraints not satisfied on 3 nodes)"
The “no suitable node” message means the container has constraints that don't fit with any node in the swarm. In the default YAML files, the only required constraints are to pin services with volumes to specific nodes based on the label. Review Step 9 in the “Summary of Installation & Configuration Steps” in the ISIQ Deployment Guide to ensure that node labeling was done correctly.
(5) If containers are frequently restarting, are there docker daemon error messages in syslog? The following Stack Overflow article provides guidance on how to search for these messages:
https://stackoverflow.com/questions/45372848/docker-swarm-how-to-find-out-why-service-cant-start
On most Linux distros, you can run `sudo journalctl -u docker.service | tail -n 100` to scan the latest docker daemon messages in case they show evidence for why the containers are unstable.
(6) If brokers are running but not communicating, are there errors in the broker_zoo1, broker_zoo2, and broker_zoo3 logs, and in the broker_kafka1, broker_kafka2, and broker_kafka3 logs? Even in a functioning cluster, it’s normal to see a few exceptions and stack traces at the beginning of the ISIQ broker logs. That’s because services in a cluster don't all start at the exact same time, which means initially the brokers can't talk to each other and they will report exceptions. But after a few seconds, usually less than a minute, they should all be up and running and organizing the cluster. Thus, look for errors in the broker logs that persist after the first minute.
(7) Are the nodes in your swarm configured to point to a real DNS server? If you are relying on /etc/hosts for name resolution, that approach will not work because docker only uses DNS. However, if you cannot quickly fix a DNS resolution problem, you should consider adding a YAML file parameter called “extra_hosts”. You would add it, for example, under the “connect:” service in connect-stack.yml. The parameter provides a DNS override capability inside a container. For more information, search for “extra_hosts” in https://docs.docker.com/compose/compose-file/compose-file-v3/.
(8) Have the required ports been opened? Check the “Port Usage” section of the ISIQ Deployment Guide, particularly the ports listed in the first row of the table:
|
Docker |
Docker Swarm |
swarm manager/worker |
22/tcp |
Intra-container network traffic flows over those ports. In addition, TCP ports 2181 and 3888 are required for communication between ZooKeeper services. If any of those ports are blocked by a local Linux firewall, the ISIQ cluster cannot function.
(9) What messages are displayed at the beginning of the broker_zoo1, broker_zoo2, and broker_zoo3 logs? You should verify that the “INFO” messages accurately reflect your cluster configuration, such as
INFO [main:QuorumPeer$QuorumServer@184] - Resolved hostname: zoo1 to address: zoo1/10.0.1.9
INFO [ListenerThread:QuorumCnxManager$Listener@736] - My election bind port: zoo1/10.0.1.9:3888
INFO [main:Environment@100] - Server environment:host.name=zoo1
Check for “WARN” and “ERROR” messages such as “Cannot open channel to xxx” or “Connection refused”, which indicate an inability for ZooKeeper services to talk to one another.
(10) Was your cluster implemented on a system or systems that previously hosted a single-node ISIQ? If so, did you run `docker volume prune --all` to erase leftover volume data from the single node? If you didn’t prune the volume, the ZooKeeper service might be using an incorrect server ID. The ID is originally pulled from the broker-stack.yml file (e.g., ZOO_MY_ID: 2), but that value is only used for the first startup. After that, ZooKeeper pulls the value from the “broker_isiq_zdata” volume. If there’s residual data on the volume when you start your cluster, ZooKeeper might have incorrect information about its own identity, which can cause connection failures to and from other ZooKeeper services in the cluster. To check for this type of problem, review the startup messages at the top of each broker_zoo* log. For example, if you see a message such as this in the broker_zoo2 log:
[ListenerThread:QuorumCnxManager$Listener@736] - My election bind port: zoo1:3888
java.net.SocketException: Unresolved address
It means zoo2 is using a leftover zoo1 server ID. In that case, you should run `docker volume prune --all` on the zoo2 node so that it will restart with the correct zoo2 server ID.
(11) Consider simplifying your environment to facilitate diagnosis. For instance, if you are debugging a networking problem in your cluster, you don’t necessarily have to run `isiq start` to deploy all of the ISIQ stacks. Instead, deploy one stack at a time. Run `docker stack deploy -c yml/cluster/broker-stack.yml broker` to start only the broker stack with its ZooKeeper and Kafka services. By doing so, you can focus on troubleshooting those specific components. Once you verify they are stable and communicating with each other, you then run `docker stack deploy -c yml/cluster/connect-stack.yml connect` to focus on stabilizing communication with the connect services in the cluster. At that point, you can run `isiq start` to deploy the full set of ISIQ stacks and services.
Diagnosing Database Problems
Since ISIQ is a data integrator, it connects to an assortment of product databases. Here are some database problems that you might encounter when you work with ISIQ, and the suggested steps for diagnosing and resolving the problems:
ORA-00604: error occurred at recursive SQL level 1 ORA-01882: timezone region not found
If you configured an Oracle database for IBM Security Identity Manager or for IBM Identity Governance and Intelligence, and you see a “timezone region not found” error, you need to modify your connect-stack.yml file. Under “services: -> connect: -> environment:” find the KAFKA_HEAP_OPTS environment variable and append “-Doracle.jdbc.timezoneAsRegion=false”. The KAFKA_HEAP_OPTS env var then looks like this:
- KAFKA_HEAP_OPTS=-Xms256M -Xmx2G -Doracle.jdbc.timezoneAsRegion=false
After you save connect-stack.yml, restart the connect and app stacks so that the change takes effect.
Database communication error: [jcc][t4][10262][11223][4.21.29] Unexpected Throwable caught: null. ERRORCODE=-4228, SQLSTATE=null
If your ISIQ System Health dashboard shows multiple database communication errors for a configured IBM Security Identity Manager or Identity Security Verify Governance product, you need to gather more data to narrow down the problem since 4228 is a generic JDBC error that can occur for various reasons.
1. If it is DB2, are there any recurring errors in the db2diag.log file? For example, if you see “SQL8001N An attempt to connect to the database failed due to a product license problem” in IGI’s db2diag.log, that message indicates you must correct the DB2 license file for IGI.
2. Examine the messages from the ISIQ connect_connect service by running
docker service logs -t connect_connect > connect.log 2>&1
Check whether the connect.log includes database errors with more surrounding context to help you pinpoint the cause.
Database communication error: [jcc][t4][2034][11148][4.21.29] Execution failed due to a distribution protocol error that caused deallocation of the conversation. A DRDA Data Stream Syntax Error was detected. Reason: 0x3. ERRORCODE=-4499, SQLSTATE=58009
If you use SSL connections to ISIM and you see this database communication error, often along with the following connection error to ISIM web services:
Failed to connect to ISIM server with base URL https://[IP-Address]:[Port#]: WSDLException: faultCode=WSDL4JWrapper : : javax.wsdl.WSDLException: WSDLException: faultCode=WSDL4JWrapper : : javax.net.ssl.SSLException: Unrecognized SSL message, plaintext connection? (com.ibm.kafka.connect.isimws.GenericClient)
It generally means the TLS level is not configured correctly. Check the “com.ibm.ssl.protocol=” property in ISIQ’s <starterKitDir>/cfg/connect/ssl/ssl.client.props. If you are using TLSv1.2, ensure that you set “com.ibm.ssl.protocol=TLSv1.2”. After you make the update, restart the ISIQ connect and app stacks.
Database ERROR: Exception getting max value for event category: Reconciliation: DB2 SQL Error: SQLCODE=-204, SQLSTATE=42704, SQLERRMC=ISIMDB.AUDIT_EVENT
The ISIM source connector attempts to read EventCompletion data from the AUDIT_EVENT table in the ISIM database. The "SQLCODE=-204, SQLSTATE=42704" DB2 error means “object does not exist”. If ISIMDB.AUDIT_EVENT does not exist, the most likely explanation is a schema problem.
By default, when you configure an ISIM product in ISIQ, the “Database User” is assumed to be the same as the ISIM database schema name. If the two are not the same, you can override the schema by appending a “:currentSchema=xxxx” parameter to the “Database URL”. For more information, see the Usage Notes in the "Configuring ISIM" section of the ISIQ User’s Guide.
In this example, if you determine that “ISIMDB” is not the correct schema for your ISIM database, update the ISIM product configuration in ISIQ to set a schema override, save the configuration update, and then check if the "SQLCODE=-204, SQLSTATE=42704" errors stop appearing in the ISIQ connect_connect log.
Failed to insert or update an entry. SQL: INSERT INTO IGACORE.USER.ERC
Errors during IGI database inserts can sometimes be length-related. For example, suppose you see numerous errors such as the following in your connect_connect log:
ERROR [conn:admin.IGI01.IGI_database:Write DB:58] Failed to insert or update an entry. SQL: INSERT INTO IGACORE.USER_ERC (ATTR11, ou, surname, ATTR1, ID, pm_code, given_name) DB2 SQL Error: SQLCODE=-723, SQLSTATE=09000, SQLERRMC=IGACORE.TRG_USER;-433;22001;admin.ISIM01:erglobalid=A25635,ou=orgChart, DRIVER=4.21.29 (com.ibm.kafka.connect.igi.util.DatabaseIO)
The “-433” DB2 SQL code means that a value is too long. If your ISIM was customized with long DN, OU, or group name strings, the target columns in IGI’s database might not be large enough to hold the strings that ISIQ attempts to insert.
To address this situation, IGI introduced a database table, DATA_TRANSFORMATION_MAPPING (DTM). If the DTM table exists, ISIQ maps a compressed representation of the string, which fits within the target IGI table, to the original string, which ISIQ stores in the DTM table. By leveraging this mapping method, ISIQ’s database inserts can still succeed, and you will have access to the original uncompressed strings in IGI. If your IGI has a DTM table but length errors are still occurring, report the issue to IBM Customer Support. It could mean that ISIQ is not using the DTM table for the particular column that is encountering the error.
Diagnosing LDAP Problems
If ISIM data is missing from your directory source topics, for example, if certain ISIM users are not in the “directory.Person” topic, you should focus attention on ISIM’s LDAP server and whether ISIQ can successfully read from it. Review the suggestions in “Verifying ISIM Data Loading” in the ISIQ User’s Guide. Then, consider the following questions:
(1) Is ISIQ pointing to the same LDAP server as ISIM, or is ISIQ reading from a replica? If it's a replica, does the replica have all the same entries as the primary or have there been replication errors?
(2) Is the ISIQ user (i.e., the "Directory User DN" value specified when configuring the ISIM product in ISIQ) that connects to LDAP the same as the ISIM user? If it's not the same user, does the ISIQ user have the same permissions as the ISIM user? The ISIQ user must have admin-level authority to perform a sorted LDAP search based on modifytimestamp. If ISIQ is not using an admin account such as cn=root, you can still grant the required permission by setting ibm-slapdSortSrchAllowNonAdmin to TRUE in the ibmslapd.conf file on your IBM Security Directory Server (SDS) system. The ISIQ user does not need write access to LDAP, but it must have read access to all the data and to the changelog.
(3) Are there any LDAP search limits in place, perhaps which only affect non-admin users?
(4) Is a non-default LDAP tenant being used? If you left "Tenant DN" blank when configuring ISIM, ISIQ assumes a default "global" tenant and reads the "global" settings in cfg/connect/isimConfiguration.json. However, if you specified a non-default LDAP tenant in ISIQ, did you add settings for it in isimConfiguration.json? If so, does the non-default tenant have "ldapSearchLimit" and "ldapLookAhead" overrides? For more information about setting LDAP search parameters, see the "Configure LDAP Search Limit and Lookahead Values" section in Appendix E of the ISIQ User’s Guide.
After answering these questions, be aware of several other LDAP issues which can impact ISIQ:
LDAP connection count growing steadily
If you have a Windows-based SDS for the ISIM that ISIQ is configured to, you might encounter a problem in which the LDAP connection count keeps growing. You detect the growth by issuing multiple “netstat” commands on the SDS system, and you observe a steady increase in the “currentconnections” and “totalconnections” values. If this scenario occurs, review the SLAPD_OCHANDLERS variable in the ibmslapd.conf file on Windows. The default value for the variable is 10. To allow the LDAP server to handle more simultaneous incoming connections, increase the value to 15, 20, or a higher number depending on the expected volume of connections. For more information, see the technote at https://www.ibm.com/support/pages/tuning-slapdochandlers-handle-more-connections
If you have a Linux-based SDS, it’s also possible to experience a high LDAP connection count. For example, when you configure an ISIM product in ISIQ, if you enter an invalid Directory User DN, that user will not be authorized to connect to your ISIM LDAP directory. But the ISIM connector in ISIQ will keep retrying the connection. Depending on the nature of the failure, the retries might cause a marked increase in open LDAP connections. In that circumstance, you should check the Administration Server log file, ibmslapd.log, on your SDS to determine whether there are hundreds of “User XXX doesn’t exist” or similar errors indicating the ISIM configuration in ISIQ must be corrected to specify a valid user.
ISIM LDAP connect reset threshold reached
The following alert on the ISIQ System Health dashboard:
“ISIM LDAP connect reset threshold reached for <yourISIMproductName>. You must resolve LDAP errors before manually restarting ISIM connector.”
means that ISIQ’s directory source connector tried unsuccessfully ten times over a span of three minutes to get a valid connection from the LDAP connection pool. After failing a tenth time, the directory source connector stops and waits until you’re able to resolve whatever is wrong with the LDAP server.
The alert signifies there is a problem communicating with the LDAP server. It could be that all available LDAP connections have been used. To determine whether that is true, ssh to the SDS system and run a netstat command, filtered by the LDAP listening port, and count the number of active connections. The netstat output shows the source IP address of each connection, which can identify the application that is consuming most of the resources. After you free a block of connections, for example, by stopping an application that is consuming too many LDAP connections, you can then restart ISIQ (or just ISIQ’s connect and app stacks is sufficient) and the directory source connector will obtain the connections it needs and perform its work. If you’re not able to free connections through stopping an application or other intervention, then you must restart the LDAP server before you restart ISIQ.
However, restarts alone might not be adequate to prevent the problem from reoccurring. For a more thorough troubleshooting approach, here are the recommended steps:
1. Check the Administration Server log file, ibmslapd.log, on your SDS. Are there errors or warnings in the log that shed light on the communication problem?
2. Are there network devices between ISIQ and LDAP, for example, an F5 load balancer or firewall that might be interfering with ISIQ’s ability to connect to LDAP?
3. Is the LDAP a single server or part of a replication cluster? If the latter, is it a read-only replica?
4. Before you restart ISIQ, clear the “connect reset threshold reached“ alert on the System Health dashboard so that it will be easier to detect if the problem reoccurs.
5. Shut down ISIQ.
6. Restart the LDAP server.
7. Once LDAP is up and running, issue another netstat command to confirm that there are minimal active connections to the LDAP port.
8. Start ISIQ.
9. If the alert shows up again in the dashboard, collect the ibmslapd.log and the ISIQ connect_connect log for IBM Customer Support to review.
LDAP error code 53 when running migrate or validate tool
When you use ISIQ’s migrate or validate tool against a large-scale ISIM-IGI environment, you can encounter “LDAP: error code 53 - Unwilling To Perform” messages, and the tool won’t complete.
For example, let’s suppose you notice that all of your accounts are not being migrated after you run “startAL.sh MIgrateAccount”. You look in the migrateAccount.log file and see these intermittent errors:
javax.naming.OperationNotSupportedException: [LDAP: error code 53 – Unwilling To Perform]
ISIQ’s SDI-based tools retrieve one page at a time from LDAP. Each page contains 100 results. If processing 100 results takes longer than the default five-minute idle timeout, LDAP will close the connection and send error code 53 when the AL iterator attempts to get the next page of 100 results.
You can try working around the issue by changing the ibm-slapdIdleTimeOut=300 value in your ibmslapd.conf file. Setting the number to 600 or 900 seconds is generally sufficient to ensure that all page results are processed before an idle timeout closes the connection. You can then set the value back to 300 once the migrate or validate tool finishes. If you’re concerned about changing the idle timeout, or you already changed it with no improvement, you might be able to resolve the issue by increasing the LDAP page size so that more than 100 results are returned per page.
But bear in mind that “LDAP: error code 53 - Unwilling To Perform” is a fairly common error with numerous possible explanations. It could be the idle timeout or default page size setting is too low, or there’s an LDAP memory shortage, or there are too many concurrent LDAP connections. When troubleshooting error code 53 in your ISIQ validate or migrate logs, it’s a good practice to approach it from the LDAP side since that’s where the problem originates. Review the ibmslapd.log to pinpoint where the error code is being generated. Once you better understand the root cause, search the IBM Security Directory Server documentation for configuration options that can circumvent the error.
Diagnosing Service Startup Failures
After you start the ISIQ stacks, if you find that you can’t log in to the ISIQ UI or if there’s evidence that services aren’t running, check the `docker service ls` command output as shown in this excerpt:
ID NAME MODE REPLICAS
4dcll8b4ubnk app_nginx replicated 0/1
hkv5mc6wskst app_products replicated 0/1
y20t4l0qdzr5 app_rest replicated 1/3
. . .
If any of the values under the “REPLICAS” column contain “0/1” or “0/3” or “1/3”, it means that one or more expected instances of the service are not active. Sometimes a service is slow to start. After you wait a minute or two, `docker service ls` output might consistently show “1/1” and “3/3”. But if that doesn’t happen, the usual diagnostic step of viewing `docker service logs <service-name>` messages won’t help because if the service isn’t running, it has no log messages to display.
In that circumstance, examine the docker daemon log. The method of finding the log varies from OS to OS. Refer to this Stack Overflow article for assistance:
https://stackoverflow.com/questions/45372848/docker-swarm-how-to-find-out-why-service-cant-start
In addition to the daemon log, look at `docker ps -a` output. It displays data about all containers on your system, which might provide clues about a service that won’t start or won’t stay running. The `docker service ps --no-trunc <service-name>` command can also be useful. Its output includes an ERROR column with a synopsis of the last error encountered by the service-name you specify.
Networking issues can interfere with service startup. After you stop ISIQ, the `docker network ls` command shouldn’t list any of ISIQ’s networks: zookeeper_default, broker_default, connect_default, app_default. If you see one or more of those networks listed, it means the ISIQ stacks cannot restart correctly because the prior network environment didn’t shut down cleanly. Run the `docker network prune` command. It attempts to remove any dangling, leftover networks from before.
If `docker network prune` doesn’t clear the old network references, try the `docker info` command. It displays overall docker status including the status of the “Swarm”. If it’s in a “pending” or “error” state instead of an “active” state, you might need to reinitialize the Docker Swarm or restart the docker daemon. The daemon restart commands are OS-specific, but the general sequence is as follows:
sudo service docker stop
sudo rm -rf /var/lib/docker/swarm
sudo service docker start
Diagnosing OIDC Login Problems
To obtain diagnostic data about an OIDC-related login problem, set the following environment variable in the app-stack.yml file:
ISIQ_LOG_OIDC=true
After an unsuccessful login, review the additional diagnostic messages by running the command, `docker service logs app_rest`. If the app_rest log contains the following error during the OIDC handshake:
name=InternalOAuthError, errno=ENOTFOUND, code=ENOTFOUND, syscall=getaddrinfo, hostname=<your-IGI-hostname>, host=<your-IGI-hostname>, port=10443
It usually signifies a DNS resolution problem (note: you will also see a “Missing session” error in your browser). In your /cfg/oidc/oidcSettings.json file, try changing the symbolic IGI hostname to the equivalent dotted decimal IP address, and then restart ISIQ.
When debugging login problems, the `docker service logs app_nginx` command can be helpful as well. The output includes tracing of the attempt by the OIDC provider to connect back to ISIQ.
”Forbidden” error
If you configure an OIDC provider such as IGI, and you’re able to successfully log in to IGI, but you see a “Forbidden” error on the ISIQ login page when using that OIDC provider, it typically means there is a firewall or other networking issue preventing the provider from connecting back to ISIQ.
As described in the “OpenID” section of the ISIQ Deployment Guide, ISIQ’s use of OIDC requires two-way network connectivity between ISIQ and its OIDC provider. Review the Deployment Guide’s “Port Usage” section to check that the required ports for the Docker Swarm are open and available.
”OpenIDConnectStrategy requires a clientID option”
If you’re unable to log in via your configured OIDC provider, and you see a repeating error message, “OpenIDConnectStrategy requires a clientID option”, in the app_rest service log, check the app-stack.yml file. Starting in ISIQ 10.0.6, the ISIQ_OIDC_CLIENT and ISIQ_OIDC_SECRET environment variables were added to app-stack.yml. By default, those environment variables have placeholder values of “clientID” and “clientSecret”. If the variables are missing from your YAML file, or if they’re present but they still have the placeholders, you will see the repeating error messages. To resolve the problem, change the placeholders to your actual client ID and client secret values, and recycle the app stack.
”Missing session” error
“Missing session” is a common symptom when facing an OIDC login problem. As is often the case, the app_rest service log is the best source of diagnostic information to help you pinpoint the issue.
There’s one particular “Missing session” scenario to be aware of: If your IGI OIDC provider is using the default self-signed certificate, and you configure IGI as your provider in oidcSettings.json, all ISIQ login attempts fail with an HTTP 403 status, and you see a “Missing session” error in your browser. The app_rest service log displays this message:
name=InternalOAuthError, code=SELF_SIGNED_CERT_IN_CHAIN
IGI’s self-signed certificate breaks the chain of trust. To circumvent the problem, you have two options:
- Set ISIQ_OIDC_ALLOW_SELF_SIGNED=true in app-stack.yml. While this environment variable is an effective stopgap measure, it is not a recommended option to use in production on a long-term basis since it introduces risk by trusting self-signed certificates.
- Export a CA-signed certificate to IGI. Add it to the OpenID Connect Provider keystore. See https://www.ibm.com/docs/en/sig-and-i/10.0.1?topic=certificates-updating-personal-certificate-openid-connect-provider for details.
If IGI is using a CA-signed certificate that you obtained, Option 2 by itself might not be sufficient to resolve the ISIQ login problem. That's because the Node.js server running inside ISIQ’s app_rest service will not necessarily know about the intermediate and root certificates presented by the IGI OIDC provider. To resolve the issue, you need to tell the Node.js server to trust the IGI certificates, which can be accomplished by concatenating the intermediate and root certs into a cacerts.pem file that gets loaded into ISIQ. Note: the following command assumes you have copies of the IGI certs in PEM format:
cat igi_intermediateCA.pem igi_ca.pem >cacerts.pem
Place the cacerts.pem file in the <starterKitDir>/cfg/rest directory. You then need to make the following modifications to your app-stack.yml file:
1. In the “configs:” section under the “rest:” service, add these lines:
- source: cacerts.pem
target: /usr/src/app/openID/cacerts.pem
2. In the “environment:” section under the “rest:” service, add this environment variable:
- NODE_EXTRA_CA_CERTS=/usr/src/app/openID/cacerts.pem
3. In the “configs:” section at the end of the app-stack.yml file, add these lines:
cacerts.pem:
file: ../../cfg/rest/cacerts.pem
Then, run:
docker stack rm app (to stop ISIQ’s app stack)
docker ps | grep app (keep calling it until no results are returned, which means the app stack is fully stopped)
./isiq start
Diagnosing Encryption and Vault Problems
Every new product configuration, and every change to an existing configuration, has its passwords encrypted and decrypted in the ISIQ vault service, which uses the Vault secrets management tool from HashiCorp. The vault service runs in the connect stack. Vault data is stored in the metricsdb, which also runs in the connect stack.
If there are vault service initialization problems, or if problems occur when storing or retrieving vault data using the metricsdb, an error is logged and an alert shows up on the System Health dashboard. If the vault mechanism isn’t functioning, there are two main consequences:
(1) Attempts to configure new products will hang and then eventually fail because of an inability to save encrypted credentials.
(2) ISIQ connectors for existing products won’t be able to decrypt credentials, which means the product connectors cannot produce or consume data. You will see ISIQ connector tasks in a failed state, and “Error decrypting credentials” messages in the connect_connect log.
In either case, it’s a serious situation that must be dealt with right away.
First, check the status of the “connect_vault” and “connect_metricsdb” services in the `docker service ls` output. If one or both services are stopped, restart the connect stack. Because the app stack depends on the connect stack, you must also restart the app stack as shown here (note: rather than issue individual `docker stack` commands, you can run the `isiq restart` script):
docker stack rm app
docker stack rm connect
docker stack deploy -c connect-stack.yml connect
docker stack deploy -c app-stack.yml app
If the services are running but encountering problems, you should examine the logs for the two services:
docker service logs -t connect_vault
docker service logs -t connect_metricsdb
Look for any messages indicating that the vault service is not operational. For example, "core: security barrier not initialized" in the connect_vault log tells you the vault was never initialized. Initialization should normally happen during startup of the products service within the app stack. Resolving the problem will require restarting the products service. In a Docker Swarm, you can run the "isiq restart" script. In a Kubernetes cluster, delete the products pod so that it will restart and initialize the vault.
Note: The following warning message in the connect_vault log, “[WARN] no `api_addr` value specified in config or in VAULT_API_ADDR; falling back to detection if possible, but this value should be manually set”, does not indicate a vault service initialization failure. It simply means that the network address of this vault service instance was not advertised to other members in a high-availability cluster. If you want to configure an HA vault cluster, refer to the HashiCorp doc.
The most important startup message to look for in the connect_vault log is "core: vault is unsealed". This message signifies that the vault service is running and ready for use.
If the vault service is running but you’re seeing an “Error decrypting credentials” message in the connect_connect log, try re-saving the password(s) for the product listed in the error message. Navigate to the dashboard for the particular product, choose the “Edit” menu option, reenter the password(s), and click “Save”.
If re-saving passwords does not resolve decryption errors, or if the file system that holds the vault or metricsdb has been lost or erased, you must reinitialize the vault volume and reenter passwords for all of your ISIQ product configurations. Follow these steps:
(1) Shut down ISIQ
(2) Remove the vault volume using the `docker volume rm connect_isiq_vault` command
(3) Restart ISIQ
(4) Reenter and save the product passwords.
Unable to create or edit a product configuration
Creating or editing an ISIM or IGI product configuration requires using the vault service to store the product’s credentials. If the vault was not initialized, or if it was initialized but not unsealed during startup, one symptom will be an inability to create or edit a product configuration. The edit might appear to succeed, but you’ll notice that your changes aren’t being preserved. If that situation occurs, follow the steps listed above to ensure that the vault is initialized, unsealed, and ready for use.
In addition to looking at the “connect_vault” and “connect_metricsdb” service logs, you should also check the “app_rest” and “app_products” logs since they might contain clues pointing to a problem in the vault service.
Addressing Security Vulnerabilities
This section lists vulnerabilities reported when running security scans against ISIQ.
JMX RMI Exploitation
When security scanners report a JMX RMI vulnerability, they are detecting an RMI interface that is open to, and exploitable by, the outside world. But ISIQ’s RMI interface is not open to the outside world. It is only accessible inside the Docker Swarm.
However, if your company policy forbids any usage of JMX RMI, you should update the “isiq” shell script located in the starter kit root directory. In the “User Configuration” section of the script, change the DISABLE_JMX environment variable from false to true. This change causes the `isiq setup` and `isiq start` commands to deploy an alternate set of YAML files with “nojmx” in their file names. The alternate YAML files completely remove JMX from your ISIQ environment. One disadvantage of running in this mode is that if you use ISIQ’s optional logs stack, the Grafana dashboard will not have metrics to work with when creating graphs.
Diagnosing Disk Space Shortages
When you administer an ISIQ environment, you need to keep an eye out for possible disk space shortages. One likely consumer of disk space is a docker service that logs excessively. By default, ISIQ sets a limit on the number and size of its logs, but you might decide that the settings require adjustment. For more information, see the “Docker Log Rotation” section of the ISIQ Deployment Guide.
Using Logs for Troubleshooting
In most ISIQ diagnostic scenarios, the primary source of information is the logs. You can quickly view log messages by running `docker service ls` followed by `docker service logs <service-name>`, where you substitute a “NAME” value from the `’docker service ls` output, such as `docker service logs app_rest`.
Many log analyses exercises involve ISIQ’s “connect” container since it runs the Kafka Connectors and they do most of the data integration work. Thus, the following example will use the connect logs.
There are two main methods to view ISIQ’s logs:
(1) in raw format,
(2) through docker.
Viewing the raw container logs
You must have root access to view ISIQ’s raw container logs. They are located in “/var/lib/docker/containers/<containerID>”. To find the container ID for the connect service, run:
docker ps | grep connect_connect
You see output similar to:
ef3c6af23aa2 private-reg:5000/isiq-connect:latest "/bin/bash -c 'CONNE\u2026" 11 minutes ago Up 11 minutes 8083/tcp, 9092/tcp connect_connect.1.iome1ba9z66zihcze9aprhg7l
The first token is the one to take note of. By using it, you can switch to the connect container’s folder:
cd /var/lib/docker/containers/ef3c6 <tab to have the bash shell autocomplete the ID>
The full ID is much longer than the truncated version shown in this `docker ps` output. But if you use tab-completion, it saves you typing by directing you to the correct folder. Inside the folder, you find one or more files named “<containerID>-json.log(.1, .2, etc.)”. In those files, you find log messages such as:
{"log":"[2021-09-13 22:23:03,408] INFO [conn:scharle.atlantic.directory:LDAP query:116] 7 Available entries found matching baseDn=ou=org,dc=com, filter=(objectclass=erSystemRole), scope=sub, profile=ITIMGroup. (com.ibm.kafka.connect.directory.source.DirectorySourceTask)\n","stream":"stdout","time":"2021-09-13T22:23:03.408928028Z"}
If you prefer working with command-line tools such as sed, awk, grep, and cut, this raw format method supplies you with the JSON text you need to slice and dice the logs. The principal advantage of viewing raw container logs is that you don't miss a single trace message. The container logs are the most comprehensive source of logging data for a docker service. However, the disadvantages are:
(1) a relatively complex message format,
(2) the requirement for root access,
(3) the need to figure out which container directory the logs are located in.
In clustered ISIQ configurations, there’s another disadvantage: you must repeat the process of finding the right container directory on each node that’s hosting the connect service.
Viewing logs through docker
The second log viewing method, which uses docker, eliminates the need to track down each node hosting the connect service. Simply running `docker service logs connect_connect` causes docker to pull the connect logs from all participating nodes and collate them for you. The output looks like this:
connect_connect.1.iome1ba9z66z@csiiesdev | [2021-09-13 22:21:36,057] DEBUG [conn:scharle.atlantic.directory:LDAP query:131] LDAP search found object: ersapagrname=SAP_HR_CPS_SPECIALIST,erglobalid=7327962232385622714,ou=services,erglobalid=00000000000000000000,ou=org,dc=com (com.ibm.kafka.connect.directory.source.DirectorySourceTask)
The message layout is similar to what’s displayed with the raw format method, but every message is prefixed with the container identifier and hostname so that you can see which node is experiencing a problem. Although this method involves less effort than tracking down individual logs in a cluster, it still produces dense output that you might need to redirect into a file for closer analysis. Since some log output goes to STDERR, you must use this command to redirect both STDOUT and STDERR messages:
docker service logs connect_connect > connect.log 2>&1
A drawback of docker logs is that they’re subject to buffering delays, which can result in not seeing 100% of the messages. Therefore, you might have to repeat the `docker service logs` command to reach the time period you’re interested in.
Collecting Documentation to Report a Problem
To simplify common management functions, ISIQ offers an “isiq” shell script in the starter kit root directory. You can find more information about the script in the “Using the isiq shell script” section of the ISIQ Deployment Guide.
One of the script’s options is “support”. If you’re collecting documentation to report an ISIQ problem, `isiq support` is a handy command that takes a snapshot of your ISIQ installation. The command obtains your current docker and OS levels, along with copies of your YAML and config files, and zips them for uploading to IBM.
After IBM Customer Support reviews this initial documentation, you might be asked to set DEBUG logging levels in one or more ISIQ YAML files to capture detailed tracing.
Product Synonym
ISIQ
Was this topic helpful?
Document Information
Modified date:
13 March 2024
UID
ibm10717877