News
Abstract
Monitor the metrics of your choice across one or many IBM i endpoint nodes
Content
You are in: IBM i Technology Updates > Navigator for i
Custom Charts
The custom charts dashboard is a simple panel where you can define the metrics and the IBM i endpoint nodes that you want to monitor.
To get started, click the Custom Charts menu option.

A new browser tab opens and the custom charts defined are displayed while metrics collection is started.
By default, a custom chart for the signed-on GUI node is shown.

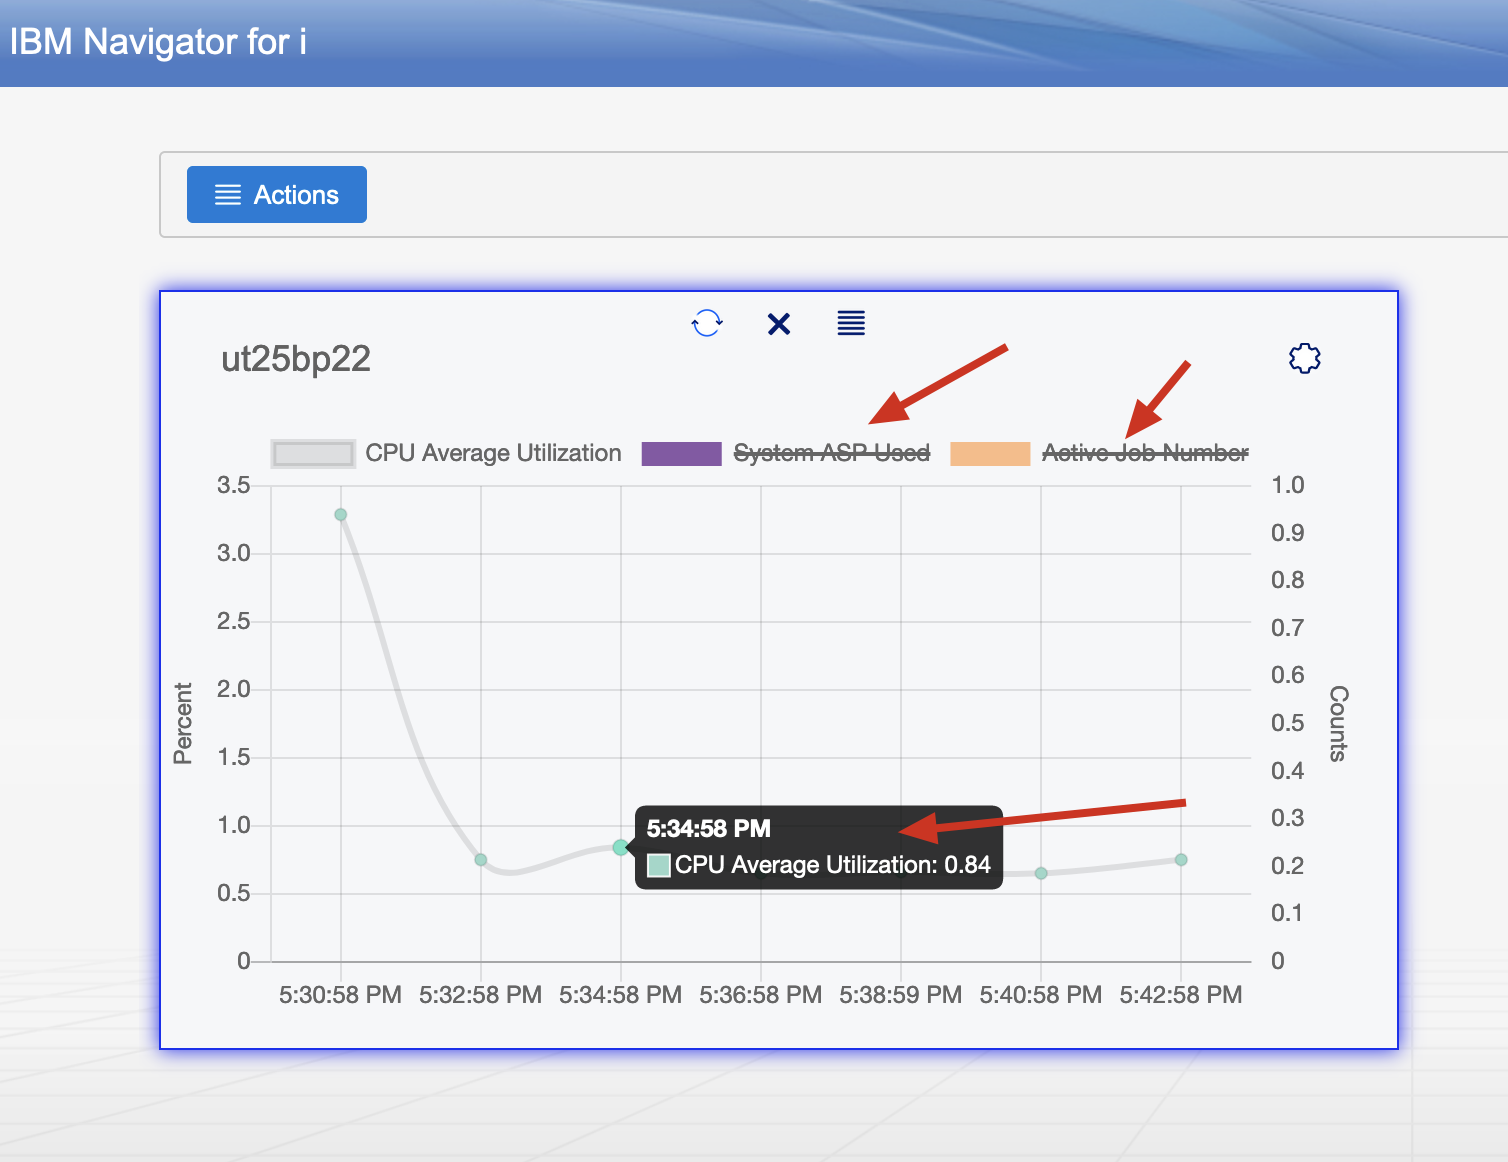
The default chart shows the GUI IBM i node with three shipped default metrics displayed.
The chart is interactive. You can click the metrics in the legend or key area to turn off that metric from view. Also, you can hover over a metric on the chart to see that actual recorded value.
The custom chart support is unique when compared to many other tools and interfaces. The metrics collected are based on the IBM i Services. Unlike other options that call system APIs, or are tied to the collection services values, the metrics for custom charts is only limited by your creativity. Custom metrics can be registered by clicking the Metrics option under the Actions button.

By default, IBM Navigator ships a limited set of custom metrics.

To add new metrics, click the Actions button and Add Metric action

You can add new metrics one at a time. Or, if you already have configured metrics on a different GUI node or user, you can easily export and import metrics into the list for this user.
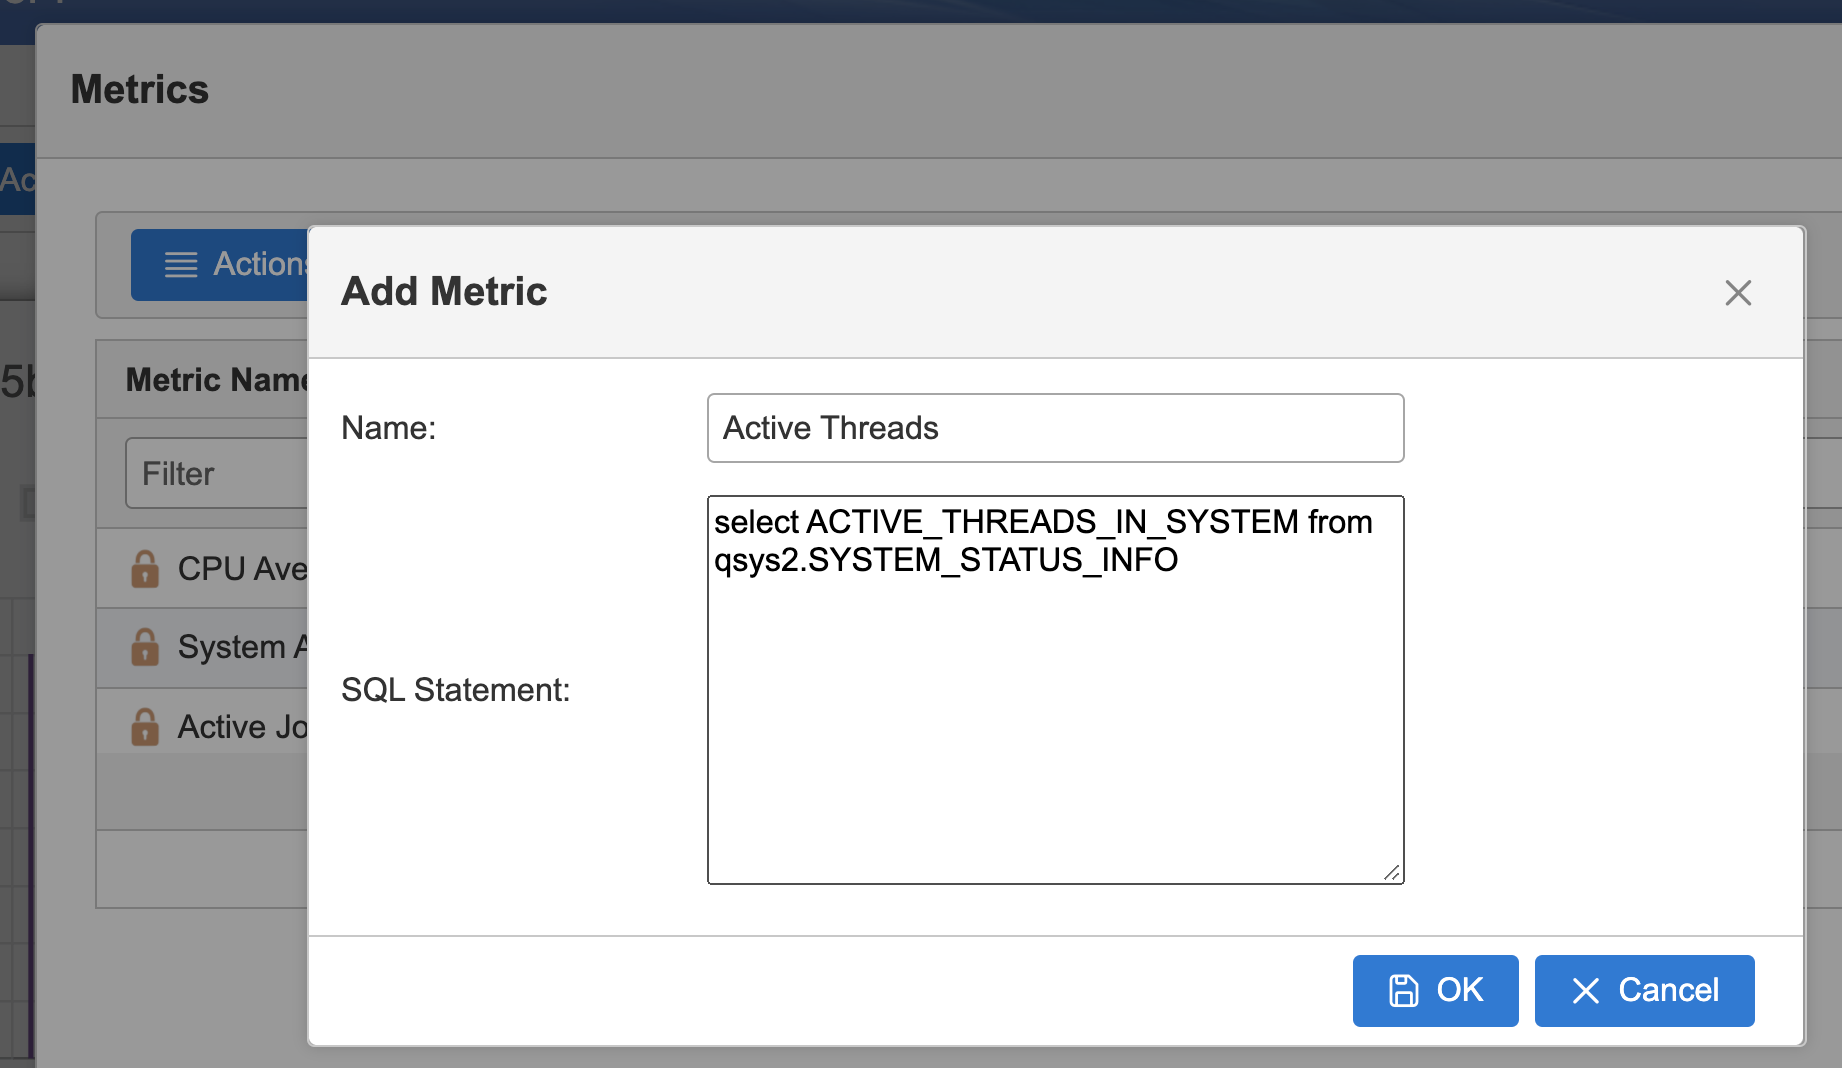
Notes: It is important to test your custom metrics carefully. Ensure that the SQL returns a correct value and does not cause adverse impacts to the IBM i end-point node. It is required that the SQL returns a single value, not a list of values. It is the users responsibility to to ensure the SQL is working in a correct manner.
Once you have defined new metrics, they can easily be added to new or existing charts.
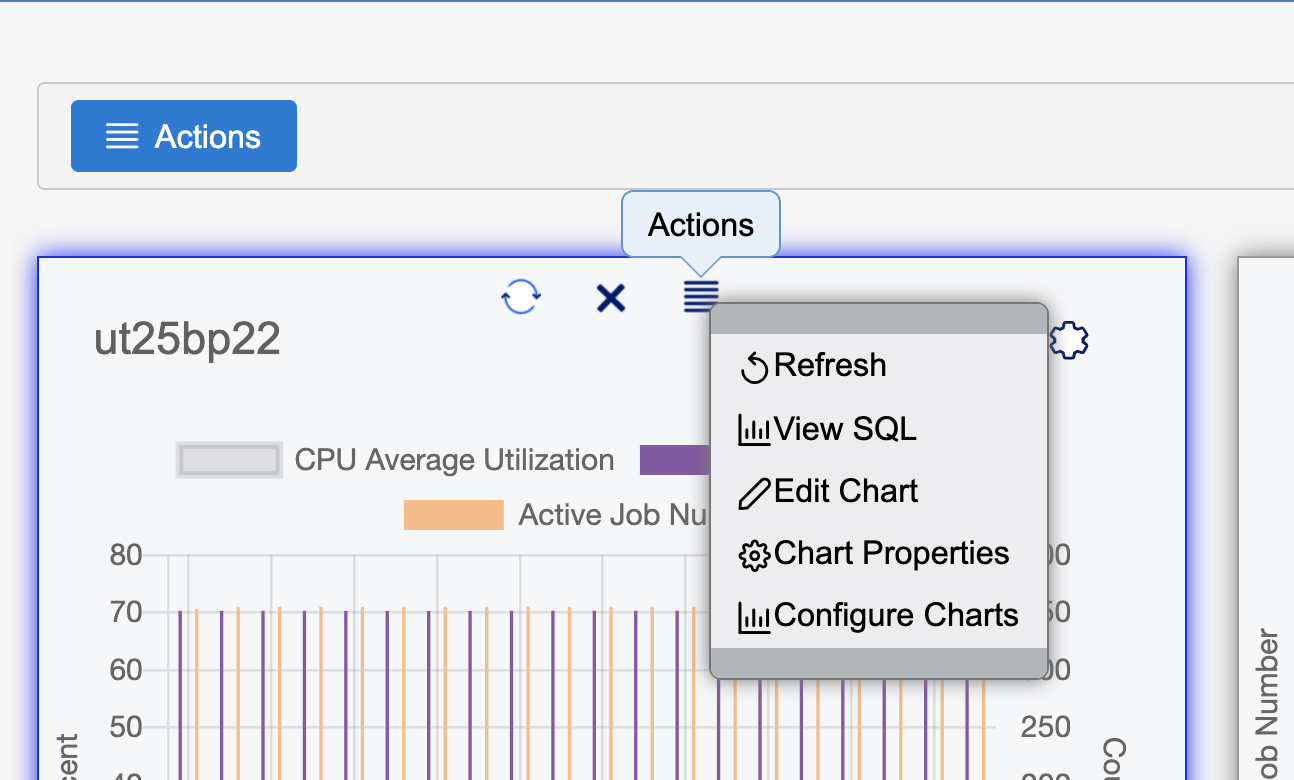
To edit the current metrics, click the Edit Chart action
Te review the SQL for each metric being monitored for this chart, click the New SQL action
Create new charts by clicking the Configure Charts action
To change the color of a metric on the chart or customize the X and Y-axis information, click the Chart Properties.
Edit and Configure Charts
When a new chart is created, you have two options:
- Monitor a single IBM i endpoint node by retrieving multiple metric values on a single chart
- Monitor a single metric value across multiple IBM i endpoint nodes
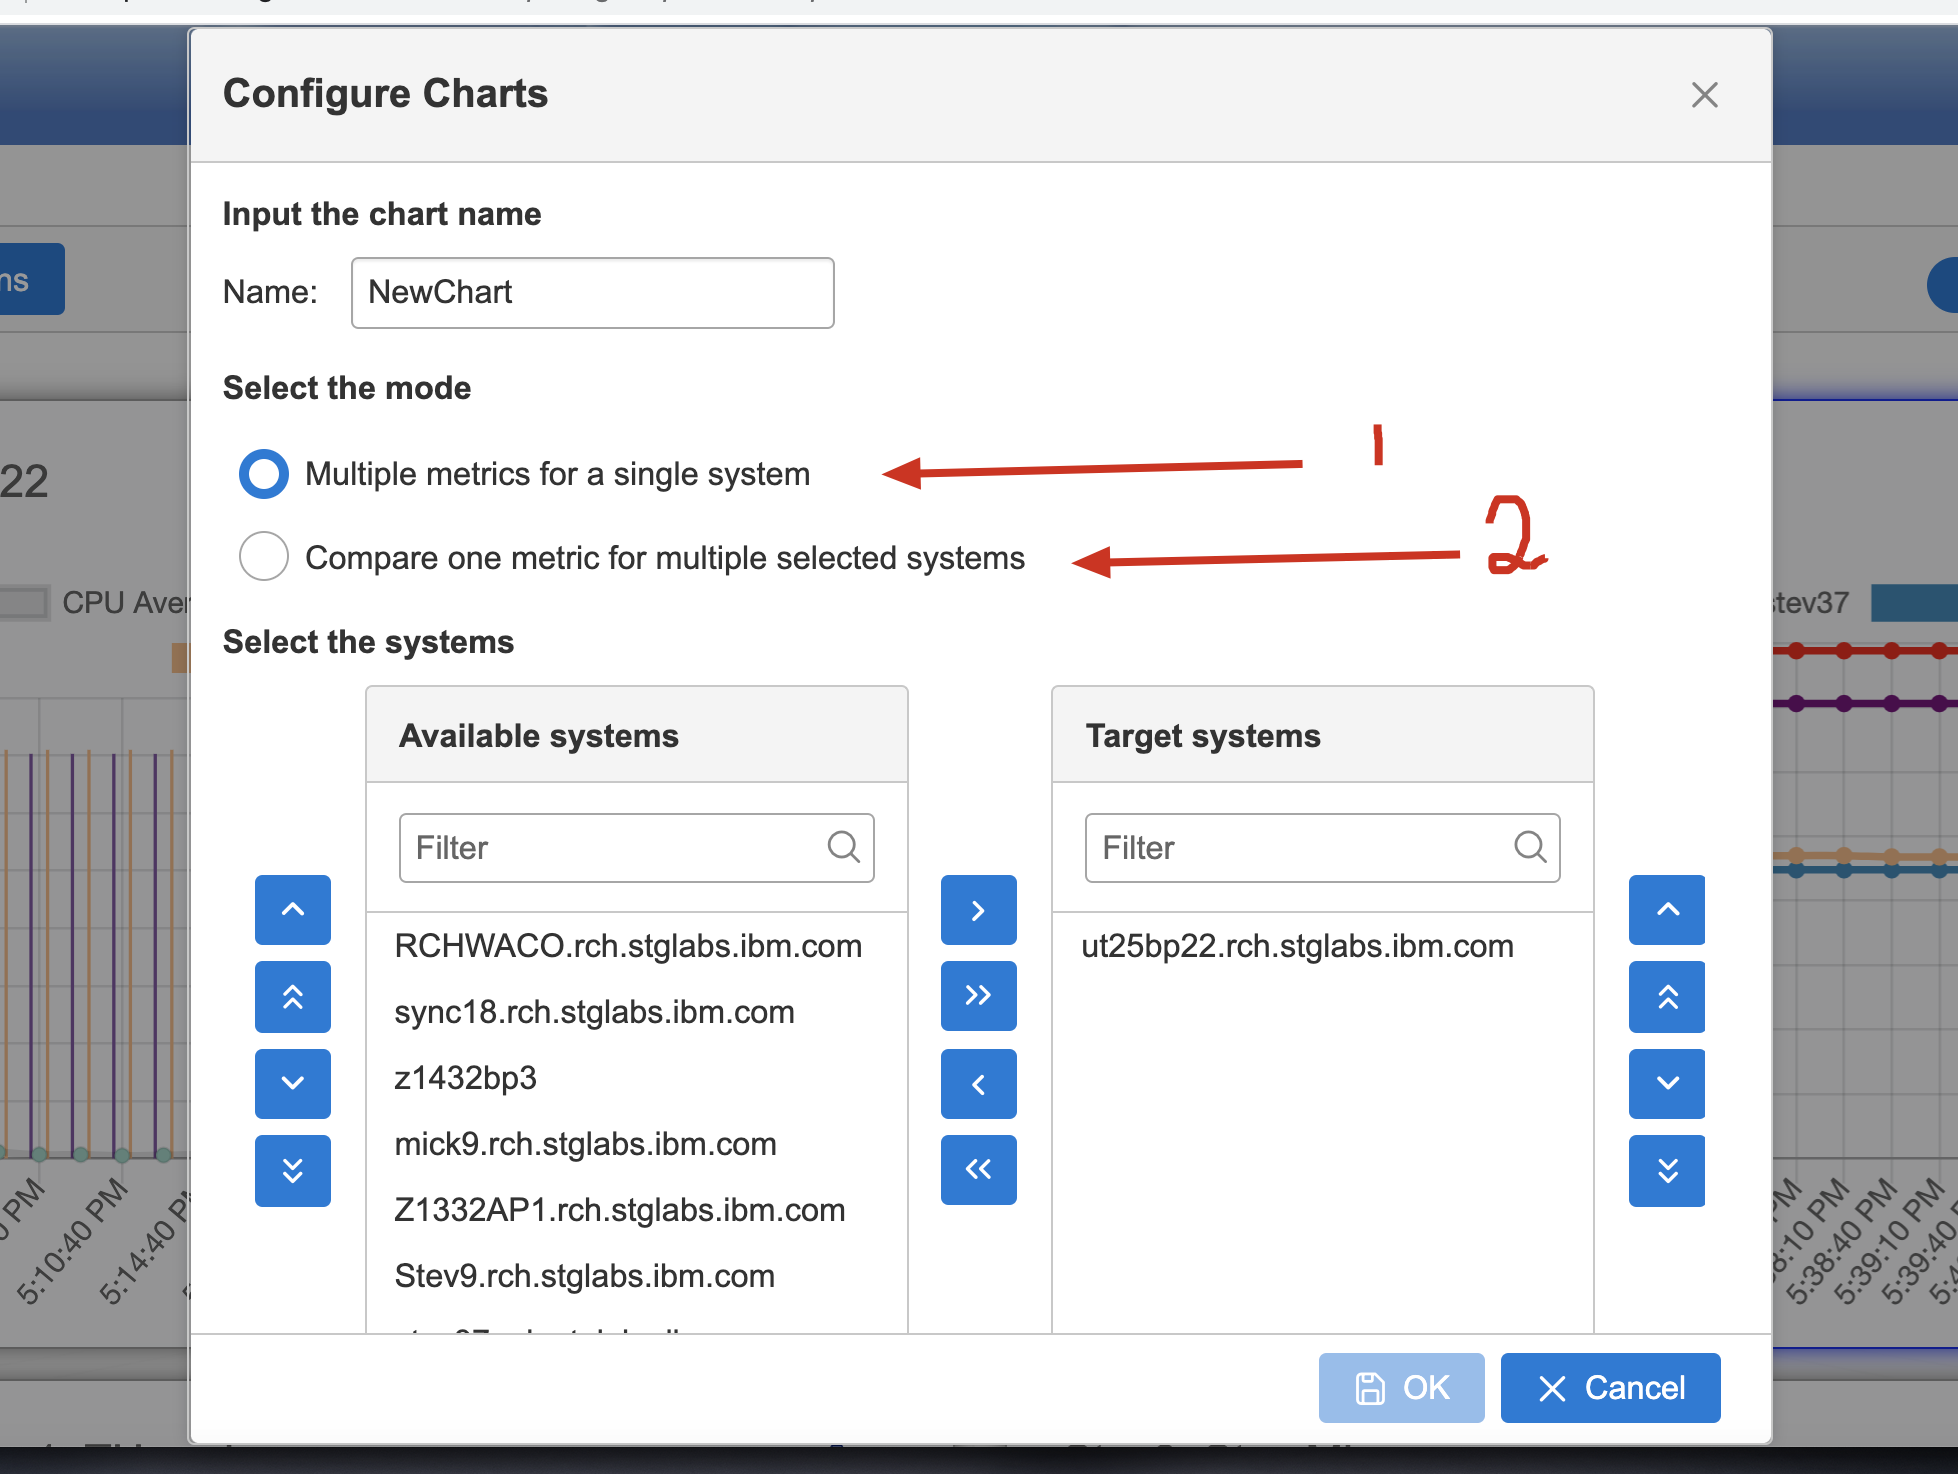
Specify a name for the chart, select the chart mode, and specify one or more endpoint nodes depending on the mode specified.
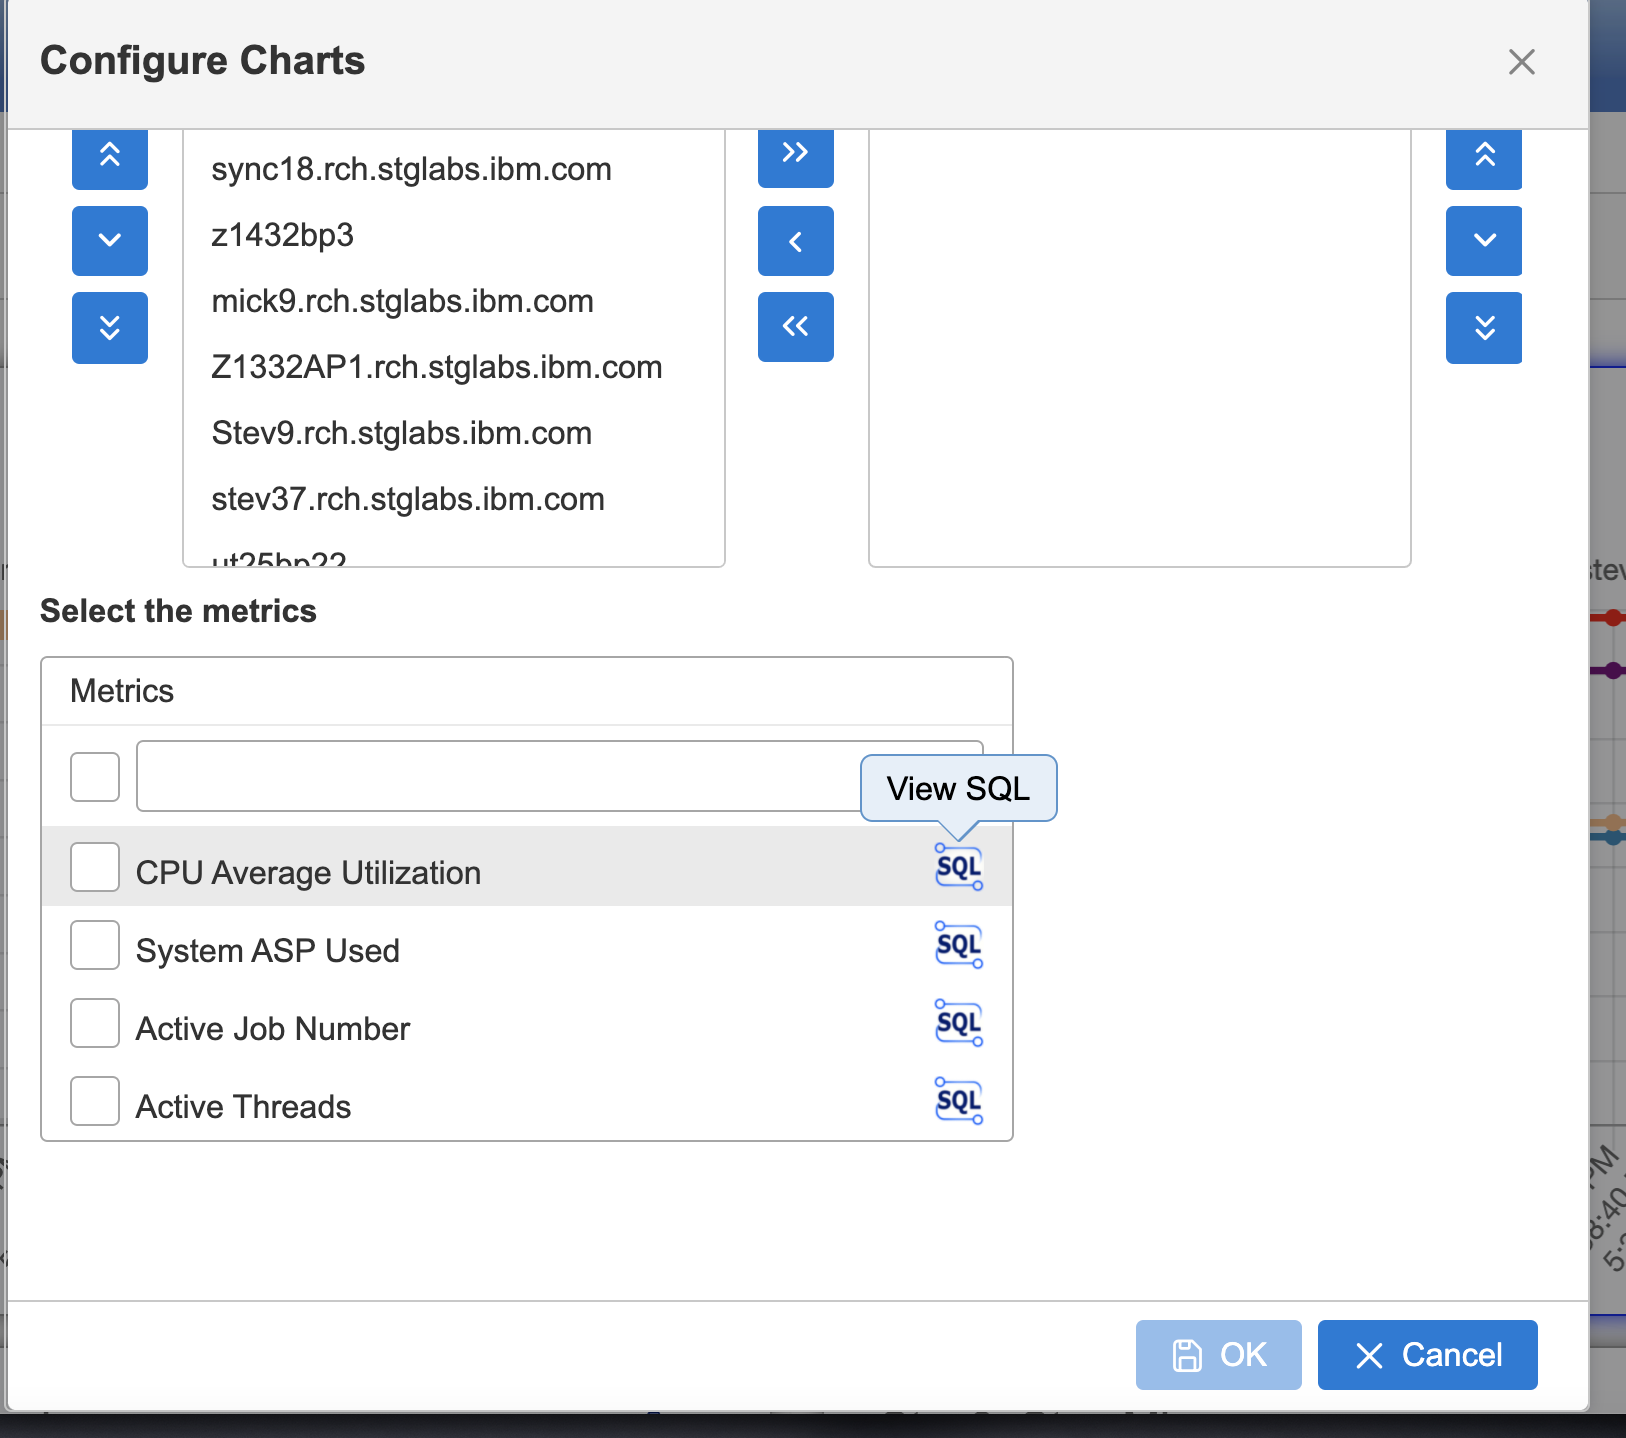
Select the metrics for this custom chart. Click the SQL button to review the SQL being used for this specific metric.
Chart Properties
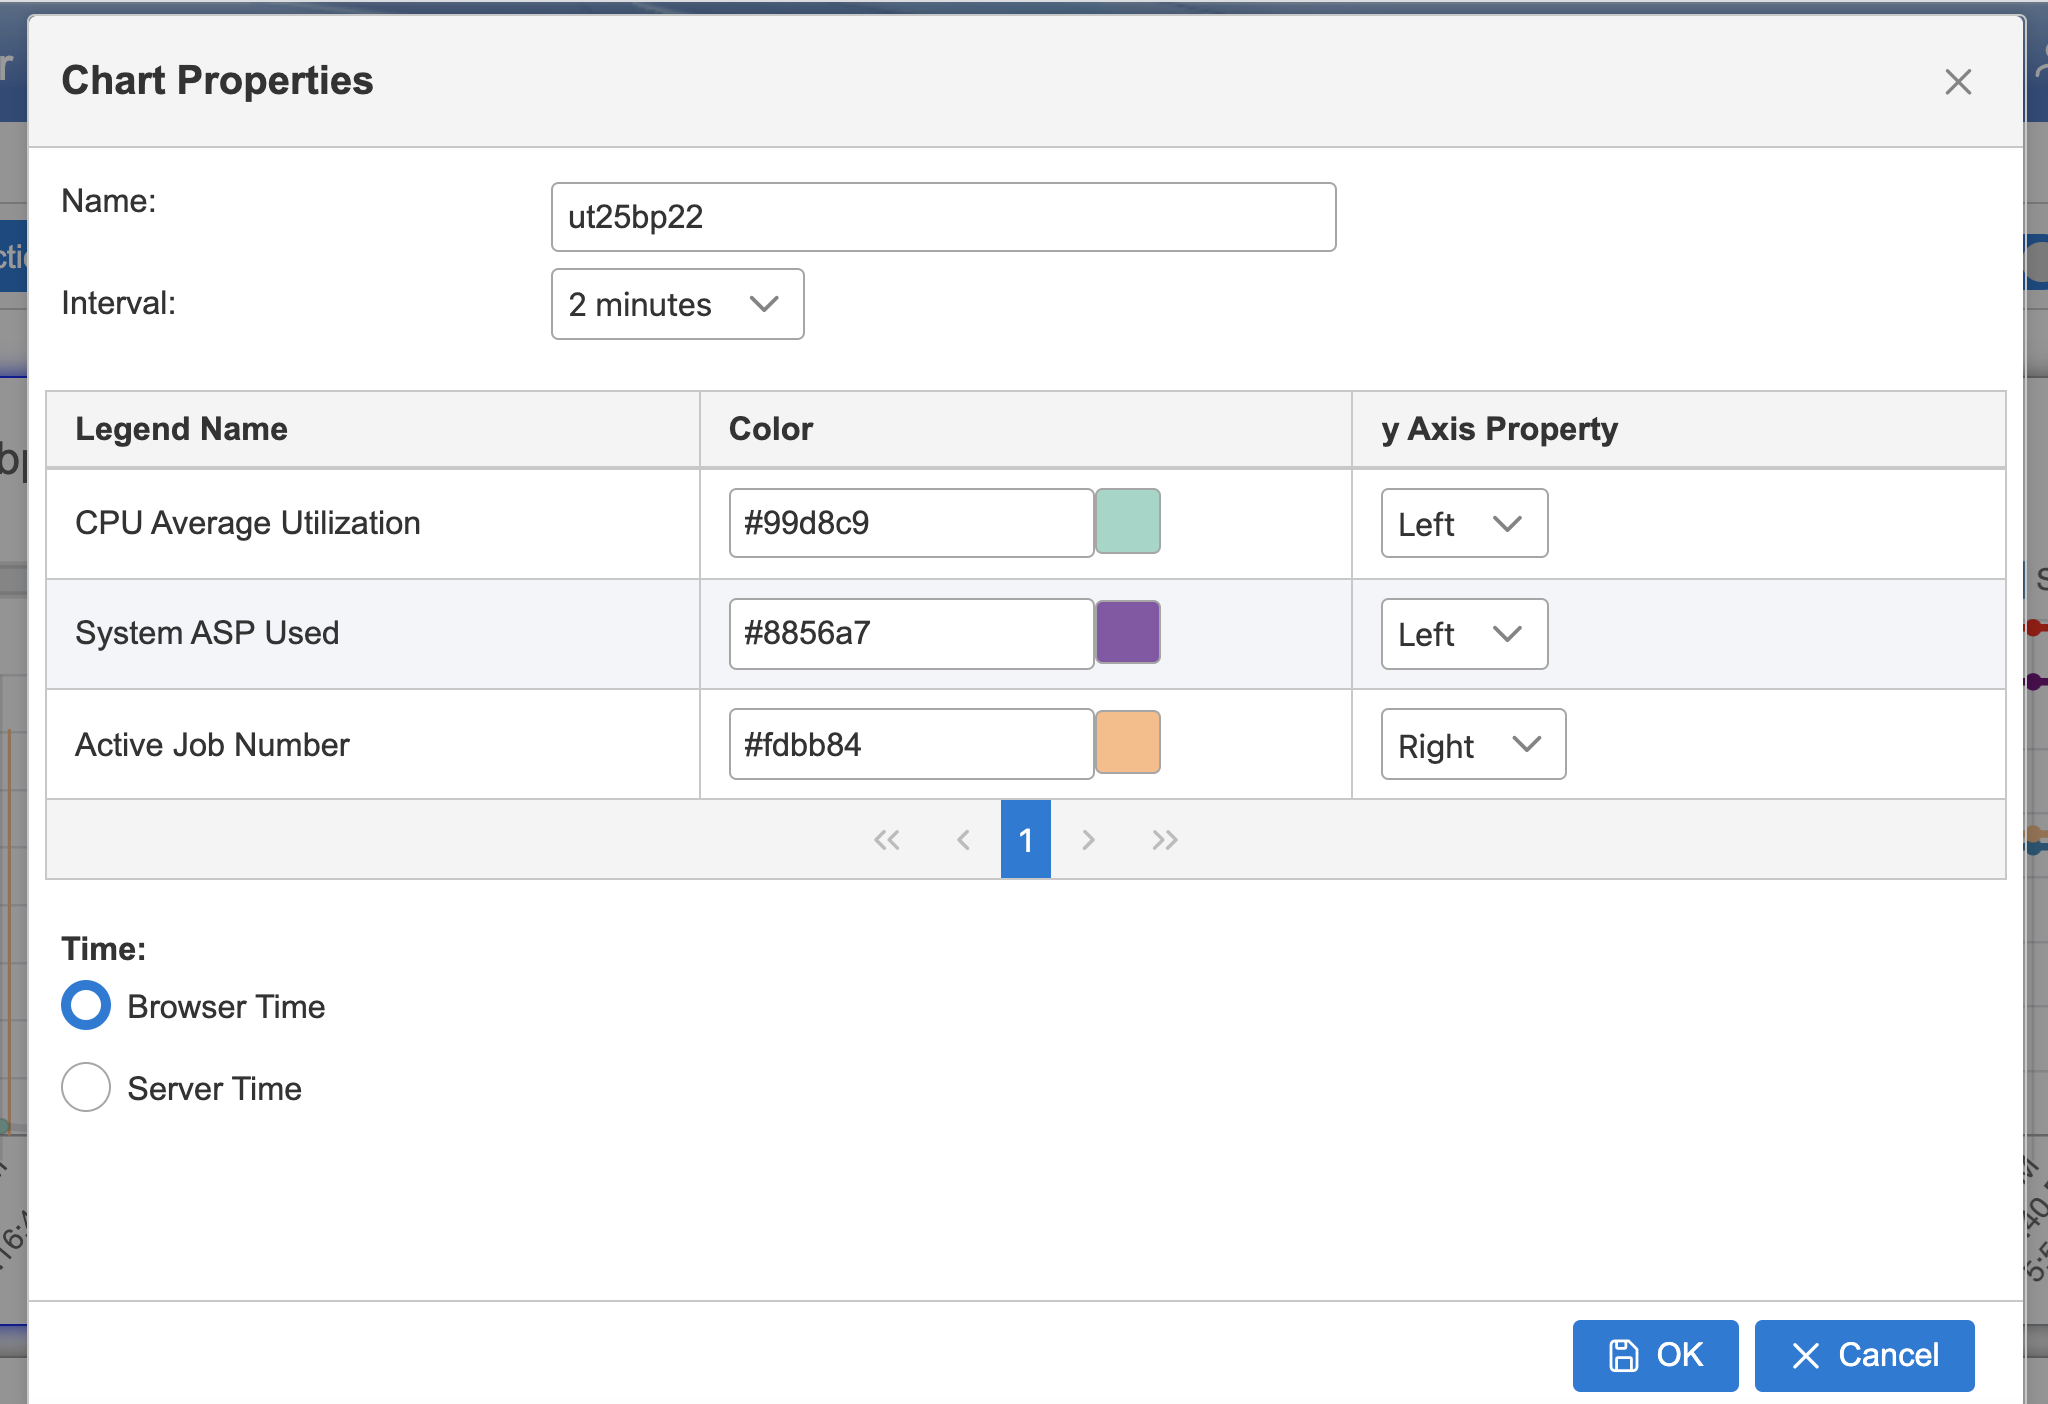
Update the name of this custom chart and the refresh interval.
Each metric has a pre-selected color that can be customized by the user.

Select the color of your choice and click the OK button to save all changes.
Custom Chart Troubleshooting and Best Practices
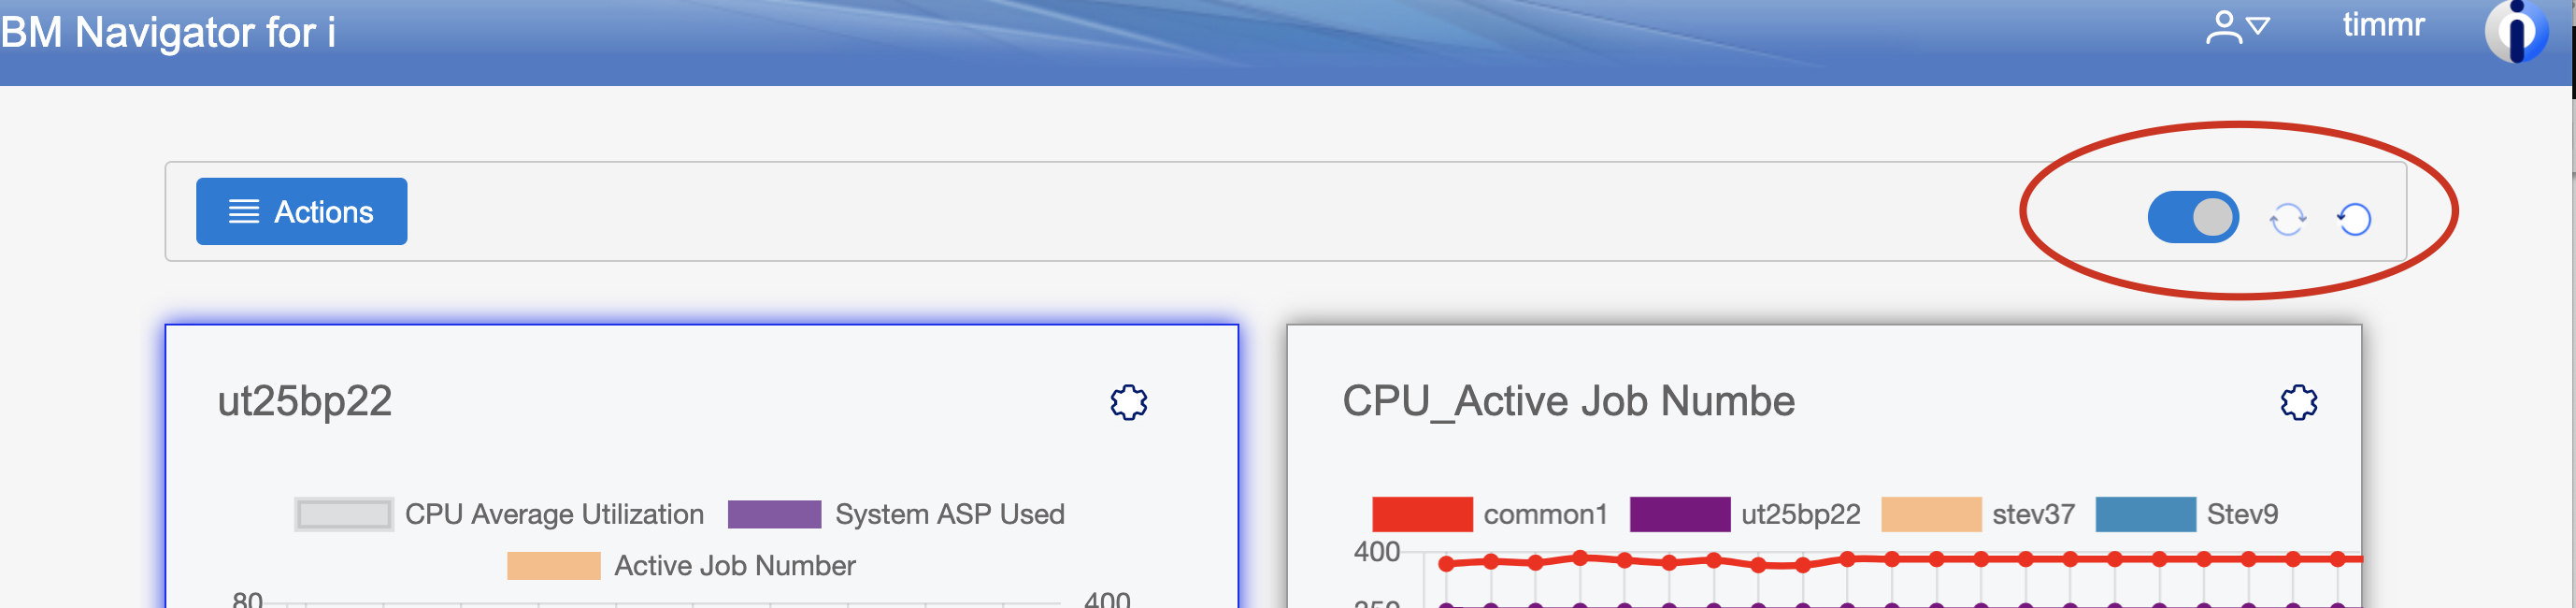
The main custom charts bar provides options to do the following:
- Shut off auto refresh
- Choose to manually refresh the charts
- Reset all charts to start over
Each metric is an SQL call to the endpoint IBM i node. It is imperative that each metric is tested fully before used.
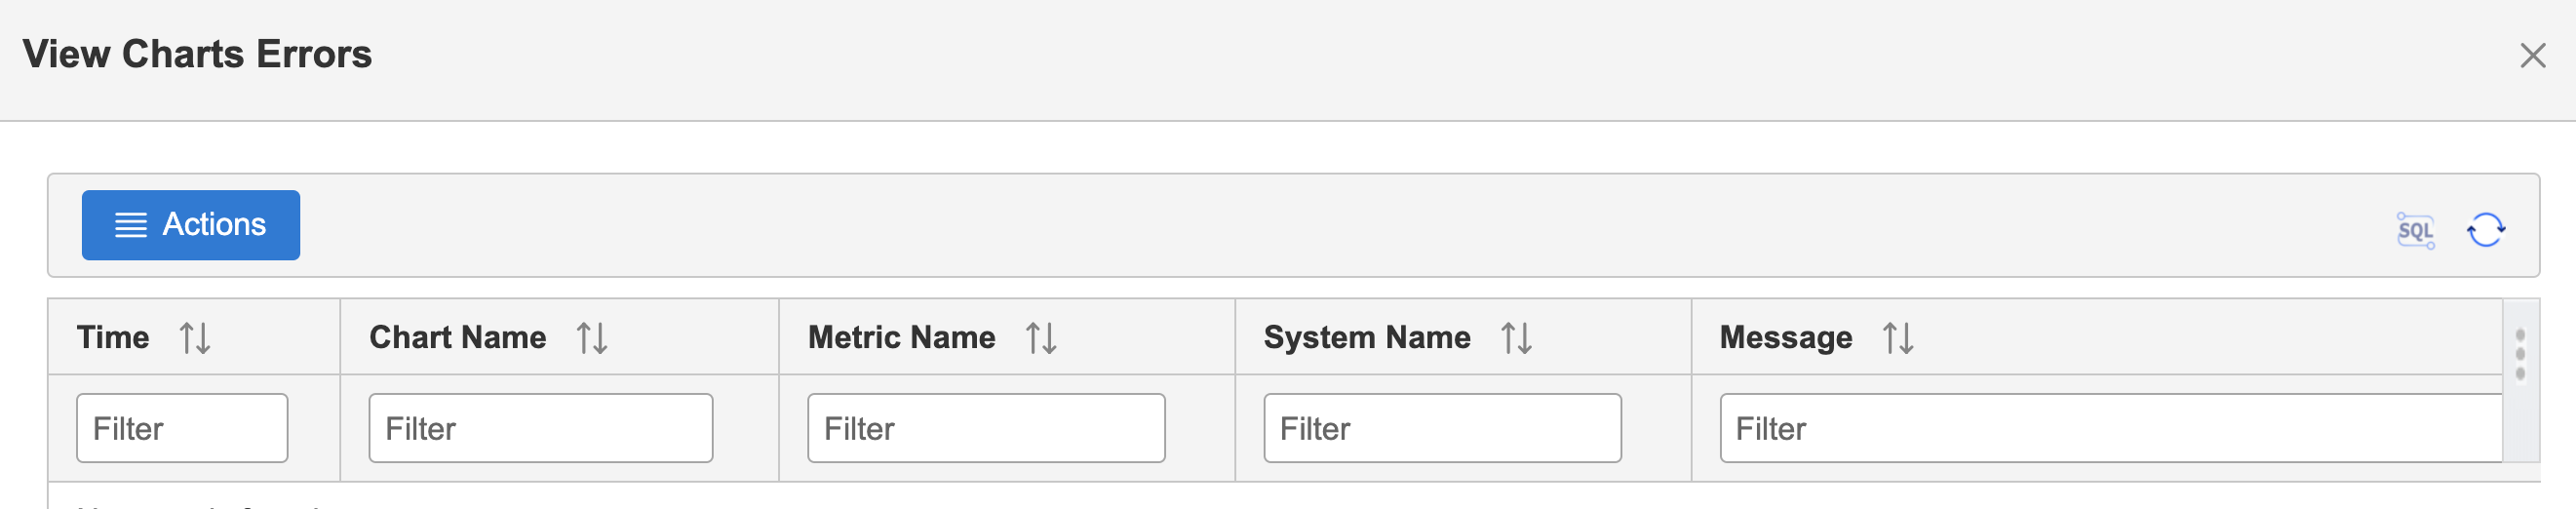
If for some reason a metric is not displaying correctly or is not retrieved, the icon in the upper right for that chart shows an error condition. To review the list of errors, under the main actions button click the View Chart Errors action.

The View Chart Errors page provides details on the errors encountered for each failing metric.
[{"Type":"MASTER","Line of Business":{"code":"LOB57","label":"Power"},"Business Unit":{"code":"BU058","label":"IBM Infrastructure w\/TPS"},"Product":{"code":"SWG60","label":"IBM i"},"ARM Category":[{"code":"a8m0z0000000CH1AAM","label":"IBM Navigator for i"}],"Platform":[{"code":"PF012","label":"IBM i"}],"Version":"7.3.0;7.4.0"}]
Was this topic helpful?
Document Information
Modified date:
08 September 2021
UID
ibm16486681