How To
Summary
This blog provides details on about how to integrate Prometheus and Grafana, working together in support of monitoring IBM Cloud Infrastructure Center nodes. Prometheus is an open source monitoring solution for storing time series data like metrics, and Grafana, an open source interactive data-visualization platform, enables visualization the data stored in Prometheus.
Environment
s390x architecture node (IBM Z® or IBM® LinuxONE)
Steps
Cloud Infrastructure Center can manage a large installation of nodes from the clusters. To enable a constant status checking of the nodes, we implemented a Prometheus infrastructure to monitor, aggregate data, and collect critical metric data. We have setup several crisis alert rules and send notification to inform user in time.
-
Data collection tools, like Node Exporter, RabbitMQ, OpenStack Exporter, and MySQL exporter, export the data into a specific format that can be loaded into Prometheus.
-
The data management tool Prometheus manages the data from different data collection tools and different nodes from Cloud Infrastructure Center clusters·
-
The data visualization tool Grafana provides a dashboard for the user that aggregates and visualizes the key metrics, like CPU, memory, and network usage.

Set up steps on monitor node
Steps to install and config Prometheus and Grafana on the monitor node.
Prometheus
Prometheus is an open source monitoring and alerting solution written in Go that collects metrics data and stores that data in a database.

Download and Installation
a. Login with an s390x architecture monitor node (IBM Z® or IBM® LinuxONE) with root, for example
ssh root@172.26.XXX.XXX
b. Create new folder for the download file
sudo mkdir downloads cd downloads
c. Get the installation package from https://github.com/prometheus/prometheus/releases
d. Copy the link for s390x architecture version (IBM Z or IBM® LinuxONE) and download
sudo wget https://github.com/prometheus/prometheus/releases/download/v2.37.6/prometheus-2.37.6.linux-s390x.tar.gz
e. Extract the build with command
sudo tar -xzvf prometheus-2.37.6.linux-s390x.tar.gz
f. Copy the binary file
sudo cp prometheus-2.37.6.linux-s390x/prometheus /usr/local/bin

sudo cp prometheus-2.37.6.linux-s390x/promtool /usr/local/bin
g. Change folder name
sudo mv prometheus-2.37.6.linux-s390x prometheus

sudo mv prometheus /etc/

chmod 777 /var/lib/prometheus/
Configuration
a. Edit the service file:
vi /etc/systemd/system/prometheus.service
[Unit]
Description=Prometheus Server
Documentation=https://prometheus.io/docs/introduction/overview/
After=network-online.target
[Service]
User=root
Restart=on-failure
ExecStart=/bin/sh -c '/usr/local/bin/prometheus \
    --config.file /etc/prometheus/prometheus.yml \
    --storage.tsdb.path /var/lib/prometheus/ \
    --web.console.templates=/etc/prometheus/consoles \
    --web.console.libraries=/etc/prometheus/console_libraries \
    --web.listen-address=0.0.0.0:9090'
[Install]
WantedBy=multi-user.target
b. Edit the service file:
vi /etc/prometheus/prometheus.yml
# my global config
global:
  scrape_interval: 15s # Set the scrape interval to every 15 seconds. Default is every 1 minute.
  evaluation_interval: 15s # Evaluate rules every 15 seconds. The default is every 1 minute.
  # scrape_timeout is set to the global default (10s).
# Alertmanager configuration
alerting:
  alertmanagers:
    - static_configs:
        - targets:
          # - alertmanager:9093
# Load rules once and periodically evaluate them according to the global 'evaluation_interval'.
rule_files:
  # - "first_rules.yml"
  # - "second_rules.yml"
# A scrape configuration containing exactly one endpoint to scrape:
# Here it's Prometheus itself.
scrape_configs:
  # The job name is added as a label `job=<job_name>` to any timeseries scraped from this config.
  - job_name: "prometheus"
    # metrics_path defaults to '/metrics'
    # scheme defaults to 'http'.
    static_configs:
      - targets: ["localhost:9090"]
  - job_name: "node_exporter"
    # metrics_path defaults to '/metrics'
    # scheme defaults to 'http'.
    static_configs:
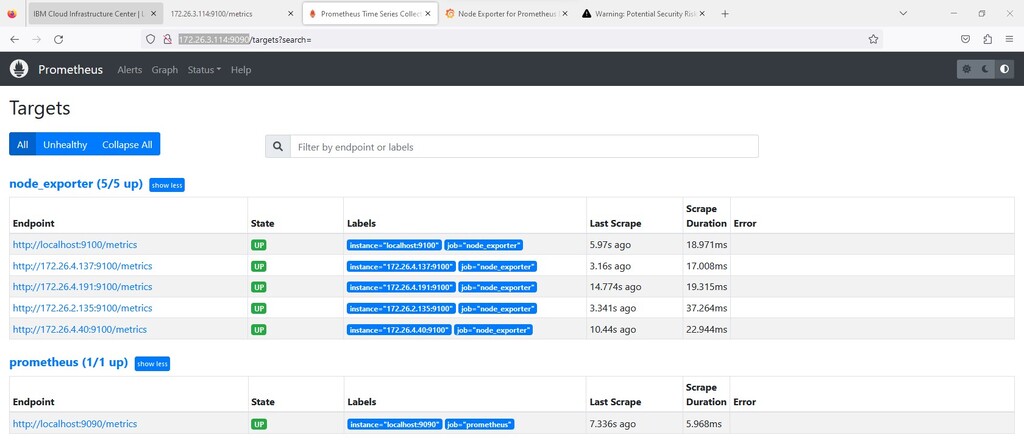
      - targets: ["localhost:9100","172.26.XXX.XXX:9100"]
Enable and start the Service
sudo systemctl daemon-reload

sudo systemctl enable prometheus.service

sudo systemctl start prometheus.service
Test the Status
sudo systemctl status prometheus.service

sudo firewall-cmd --add-port=9090/tcp

sudo firewall-cmd --reload
Access the service URL, for example http://172.26.3.XXX:9090/
Prometheus alert rules
Alerting rules enables definitions alert conditions, based on Prometheus expression language, and to send notifications about alerts to an external service.

Create an alert rule
Find the rule file path at monitor node:
/etc/prometheus/alert.rules.yml
Add rule to Prometheus config file
groups:
- name: alert.rules
  rules:
  - alert: Node_High_CPU_Usage
    expr: 100 - (avg by(instance)(rate(node_cpu_seconds_total{mode="idle"}[2m])) *100) >75
    for: 2m
    labels:
      severity: "critical"
      namespace: monitoring
    annotations:
      summary: "CPU usage on node is over 75%\n Value = {{ $value }}\n Instance = {{ $labels.instance }}\n"
      description: "CPU usage of {{$labels.instance}} is is over 75% "

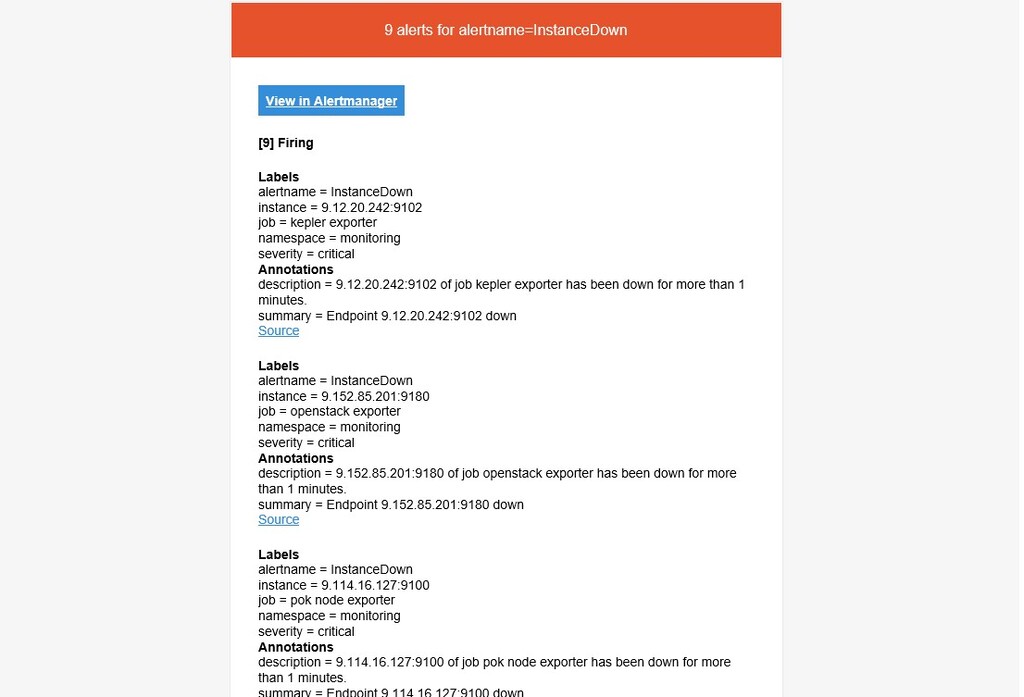
  - alert: InstanceDown
    expr: up == 0
    for: 1m
    labels:
      severity: "critical"
      namespace: monitoring
    annotations:
      summary: "Endpoint {{ $labels.instance }} down"
      description: "{{ $labels.instance }} of job {{ $labels.job }} has been down for more than 1 minutes."

  - alert: Node_High_Memory_Usage
    expr: 100 - (avg by (instance)((node_memory_MemAvailable_bytes / node_memory_MemTotal_bytes)) ) * 100 > 75
    for: 2m
    labels:
      severity: warning
      namespace: monitoring
    annotations:
      summary: "Host out of memory (instance {{ $labels.instance }})"
      description: "Node memory is filling up (> 25%)\n  VALUE = {{ $value }}\n  LABELS: {{ $labels }}"

  - alert: Node_High_Disk_Usage
    expr: (100 - (avg by (instance)(node_filesystem_avail_bytes{mountpoint="/"}/node_filesystem_size_bytes{mountpoint="/"})) * 100) >75
    for: 1s
    labels:
      severity: warning
      namespace: monitoring
    annotations:
      summary: "Host out of disk space (instance {{ $labels.instance }})"
      description: "Disk is almost full (> 75%)\n  VALUE = {{ $value }}\n  LABELS: {{ $labels }}"
Add the rule file path at:
/etc/prometheus/prometheus.yml
rule_files:
 - "/etc/prometheus/alert.rules.yml"
Restart the Prometheus service and verify that the rule is displayed correctly in the Prometheus menu.
systemctl restart prometheus
Prometheus Alertmanager
The Alertmanager handles alerts sent by client applications such as the Prometheus server. It takes care of deduplicating, grouping, and routing them to the correct receiver integration such as email, PagerDuty, or OpsGenie.It also takes care of silencing and inhibition of alerts.

Download and Installation
a. Login with an s390x architecture monitor node (IBM Z/IBM® LinuxONE) with root, for example
ssh root@9.XXX.XXX.XXX
b. Create new folder for the download file
sudo mkdir downloads cd downloads
c. Get the installation package from https://github.com/prometheus/alertmanager/releases
d. Copy the link for s390x architecture version (IBM Z/IBM® LinuxONE) of release and download
sudo wget https://github.com/prometheus/alertmanager/releases/download/v0.25.0/alertmanager-0.25.0.linux-s390x.tar.gz
e. Extract the build with command
sudo tar -xzvf alertmanager-0.25.0.linux-s390x.tar.gz
f. Copy the binary file
sudo cp alertmanager-0.25.0.linux-s390x/alertmanager /usr/local/bin
Configuration
a. Edit the service file:
vi /etc/systemd/system/alertmanager.service
[Unit]
Description=Alert Manager
After=network-online.target

[Service]
User=root
Restart=on-failure
ExecStart=/usr/local/bin/alertmanager \
  --config.file=/etc/pmalertmanager/email.yml \
  --web.external-url http://9.152.85.201:9093 \
  --cluster.advertise-address=9.152.85.201:9093

[Install]
WantedBy=multi-user.target
b. Edit the service file:
vi /etc/pmalertmanager/email.yml
global:

  resolve_timeout: 5m

route:

  group_by: ['alertname']

  group_wait: 30s

  group_interval: 5m

  repeat_interval: 1h

  receiver: 'send_email'

receivers:

  - name: 'send_email'

    email_configs:

    - to: 'test@cn.ibm.com'

      from: 'test@cn.ibm.com'

      smarthost: smtpav03.dal12v.mail.ibm.com:25

      auth_username: 'test@cn.ibm.com'

      auth_password: 'yourpassword'

      tls_config:

        insecure_skip_verify: true

inhibit_rules:

  - source_match:

      severity: 'critical'

    target_match:

      severity: 'warning'

    equal: ['alertname', 'dev', 'instance']
Enable and start the service
sudo systemctl daemon-reload

sudo systemctl enable alertmanager.service

sudo systemctl start alertmanager.service

sudo systemctl restart alertmanager.service
Test the status
sudo systemctl status alertmanager.service

sudo firewall-cmd --add-port=9093/tcp

sudo firewall-cmd --reload
Access the service URL, for example http:// 9.XXX.XXX.XXX:9093 /
Grafana
Grafana is the open source analytics & monitoring solution for databases.

Installation at monitor node
a. Refer to the detail steps at: https://grafana.com/docs/grafana/latest/setup-grafana/installation/rpm/
b. Note: Do not use Docker to install Grafana, it replies: “no s390x version image found”
Enable and start the service
sudo systemctl daemon-reload

sudo systemctl enable grafana-server

sudo systemctl start grafana-server
Test the status
sudo systemctl status grafana-server

sudo firewall-cmd --add-port=3000/tcp

sudo firewall-cmd --reload
Access the service URL, for example http://172.26.XXX.XXX:3000/
Select the data source, for example http://172.26.XXX.XXX:9090
Import the dashboard, we suggest that uses the code: 11074
Set up steps on the IBM Cloud Infrastructure Center management node and compute node
There are several datums collect tools available to choose from, we use Node Exporter.
Node Exporter
The Prometheus Node Exporter is an open source software tool that collects and exposes metrics about a machine's hardware and operating system. It is used with Prometheus, a monitoring system that can collect and store metrics from various sources.

Download and Installation
a. Login with an s390x architecture management and compute node (IBMZ/IBM® LinuxONE) with root, for example
ssh root@172.26.XXX.XXX
b. Create new folder for the download file
sudo mkdir downloads cd downloads
c. Get the installation package from https://github.com/prometheus/node_exporter/releases
d. Copy the link for s390x architecture version (IBMZ/IBM® LinuxONE) and download
sudo wget https://github.com/prometheus/node_exporter/releases/download/v1.5.0/node_exporter-1.5.0.linux-s390x.tar.gz
e. Extract the build with command
sudo tar -xzvf node_exporter-1.5.0.linux-s390x.tar.gz
f. Copy the binary file
sudo cp node_exporter-1.5.0.linux-s390x/node_exporter /usr/local/bin
Configuration
a. Edit the service file:
vi /etc/systemd/system/node-exporter.service
[Unit]
Description=Node Exporter
After=network-online.target
[Service]
User=root
Group=root
Type=simple
ExecStart=/bin/sh -c '/usr/local/bin/node_exporter'
[Install]
WantedBy=multi-user.target
Enable and start the service
sudo systemctl daemon-reload

sudo systemctl enable node-exporter.service

sudo systemctl start node-exporter.service
Test the Status
sudo systemctl status node-exporter.service

sudo firewall-cmd --add-port=9100/tcp

sudo firewall-cmd --reload
Access the service url , for example http://172.26.XXX.XXX:9100/metrics
OpenStack Exporter
The OpenStack exporter exports Prometheus metrics from a running OpenStack cloud for consumption by Prometheus.
Download and Installation
a. Login with an s390x architecture management node (IBMZ/IBM® LinuxONE) with root, for example
ssh root@9.152.85.201
b. Create new folder for the download file
sudo mkdir downloads cd downloads
c. Get the installation package from https://github.com/openstack-exporter/openstack-exporter/releases
d. Copy the link for s390x architecture version (IBMZ/IBM® LinuxONE) and download
sudo wget https://github.com/openstack-exporter/openstack-exporter/releases/download/v1.6.0/openstack-exporter_1.6.0_linux_s390x.tar.gz
e. Extract the build with command
sudo tar -xzvf openstack-exporter_1.6.0_linux_s390x.tar.gz
f. Copy the binary file
sudo cp openstack-exporter /usr/local/bin
Copy security file
scp 9.114.16.XXX:/etc/pki/tls/certs/icic.crt /etc/ssl/certs/large-monitor.crt
Edit the configuration file
mkdir -p /etc/openstack/
vi /etc/openstack/clouds.yaml
clouds:
  large-monitor:
    auth:
      auth_url: https://9.114.16.120:5000/v3
      password: dfltpass
      project_name: ibm-default
      username: root
      user_domain_name: default
      project_domain_name: default
    region_name: RegionOne
    cert: /etc/ssl/certs/large-monitor.crt
Edit the service file:
vi /etc/systemd/system/openstack-exporter.service
[Unit]
Description=OpenStack exporter
After=network-online.target

[Service]
User=root
Restart=on-failure
ExecStart=/bin/sh -c '/usr/local/bin/openstack-exporter \
    --os-client-config /etc/openstack/clouds.yaml \
    large-monitor'

[Install]
WantedBy=multi-user.target
Enable and start the service
sudo systemctl daemon-reload

sudo systemctl enable openstack-exporter.service

sudo systemctl start openstack-exporter.service
Test the status
sudo systemctl status openstack-exporter.service

sudo firewall-cmd --add-port=9180/tcp

sudo firewall-cmd --reload
Access the service URL, for example http://9.152.XXX.XXX:9180/metrics
Document Location
Worldwide
Was this topic helpful?
Document Information
Modified date:
24 July 2023
UID
ibm17011721