How To
Summary
How to change the format of data in a visualization in Planning Analytics Workspace new experience?
Steps
1. Right-click the axis title in a visualization.
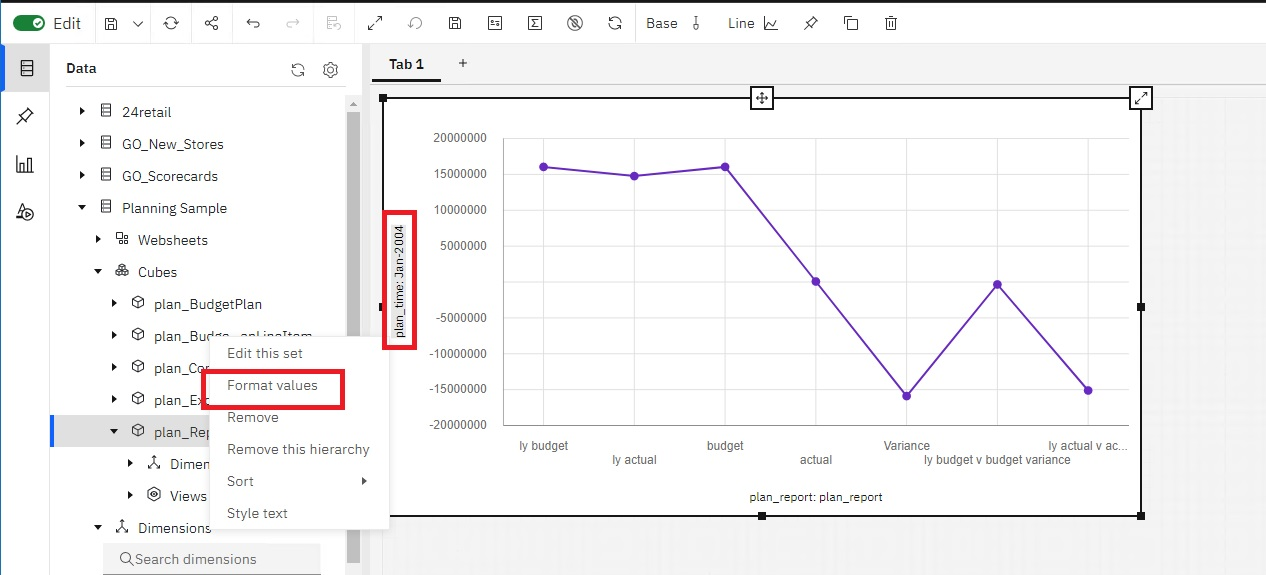 2. Click "Fomart values".
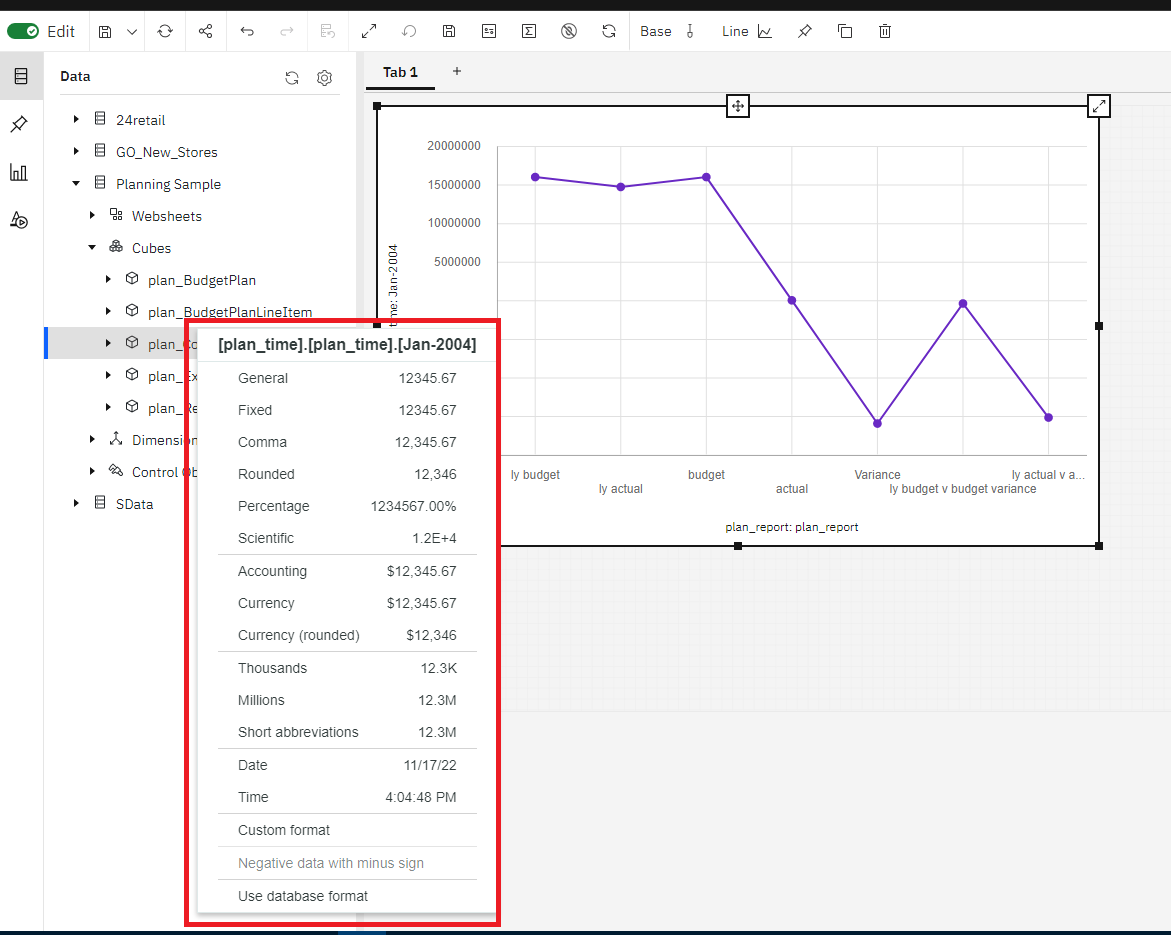
3. Click the format you want to apply.
Document Location
Worldwide
[{"Type":"MASTER","Line of Business":{"code":"LOB10","label":"Data and AI"},"Business Unit":{"code":"BU059","label":"IBM Software w\/o TPS"},"Product":{"code":"SSD29G","label":"IBM Planning Analytics"},"ARM Category":[{"code":"a8m3p000000LQtUAAW","label":"Planning Analytics"}],"ARM Case Number":"TS011239349","Platform":[{"code":"PF025","label":"Platform Independent"}],"Version":"All Versions"}]
Was this topic helpful?
Document Information
Modified date:
17 November 2022
UID
ibm16840053