Question & Answer
Question
Answer
-Xtrace:print=mt,trigger=method{com/ibm/jsse2/SSLSocketFactoryImpl.createSocket,jstacktrace} -Xtrace:print=mt,trigger=method{com/ibm/jsse2/SSLSocketFactoryImpl.createSocket,javadump}
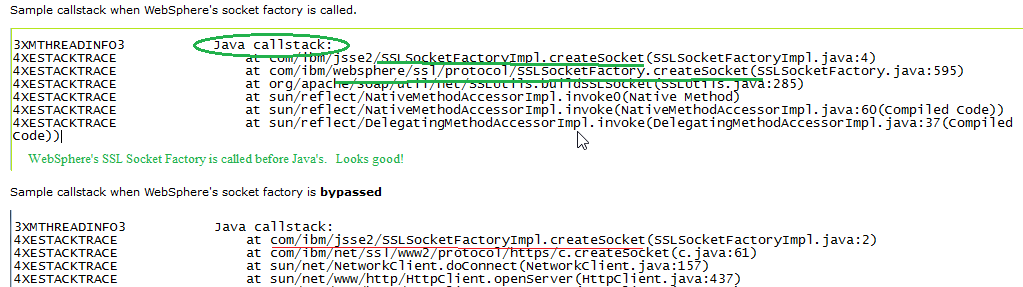
In the native_stderr.log you will see the following:
Xtrace for both SSLSocketFactory and System.setProperty
The following string will track both socket bypassed AND app setting System property
-Xtrace:print=mt,trigger=method{com/ibm/jsse2/SSLSocketFactoryImpl.createSocket,jstacktrace} -Xtrace:print=mt,trigger=method{com/ibm/jsse2/SSLSocketFactoryImpl.createSocket,javadump}
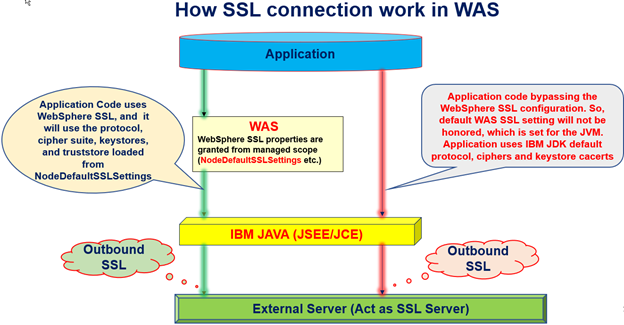
Please note that this isn't the only approach to getting this type of information. There are many other ways that application code can override default WebSphere configuration.
Detail Steps in WebSphere Application Server to Gather the xtrace to find caller using Java socketfactory
The administrative console set the javax.net.debug system property using one of the following options, depending on where the SSL issue is occurring:
Note: If you were not told which JVM to trace, or for some reason, you are not sure which of the JVMs need this kind of tracing... set it on all of them.
Type the following:
Name: javax.net.debug
Value: true
Click Apply, and Save your changes to the master configuration.
For tracing an Application server, select the following: Servers > Server Types > WebSphere Application Servers > server_name > Expand Java and Process Management (under Server Infrastructure) - >Process definition > Java virtual machine > under generic jvm argument define
-Xtrace:print=mt,trigger=method{com/ibm/jsse2/SSLSocketFactoryImpl.createSocket,jstacktrace} -Xtrace:print=mt,trigger=method{com/ibm/jsse2/SSLSocketFactoryImpl.createSocket,javadump}
Click Apply, and Save your changes to the master configuration.
Expand troubleshooting > Logs and trace > server_name.
Select Diagnostic Trace. Set the Maximum Number of Historical Files to 20.
Click Apply, then select Change log detail levels.
Set the trace specification string to:
*=info : SSL=all
Click Apply, and Save to the master configuration.
Stop the server(s) and backup/clear the logs directory for the server(s) you are tracing and the FFDC directory as well.
Start the server(s) and re-create the issue.
Was this topic helpful?
Document Information
Modified date:
24 February 2022
UID
ibm13379977