Question & Answer
Question
Answer
For the demonstration, we can use a test iBase database. We start with iBase Designer.
We create a new iBase database, using the Crime template.
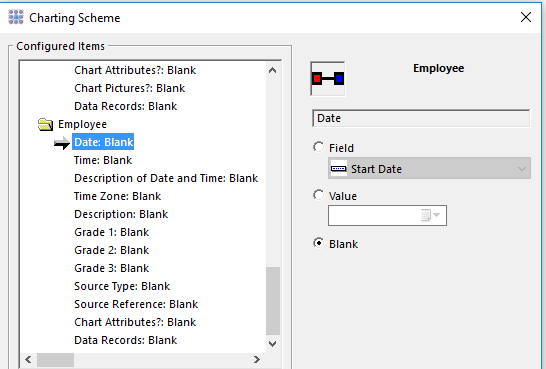
What I want to show is how you can choose one field from an iBase entity type as the Date field in Analyst’s Notebook.
And do the same for a link type.


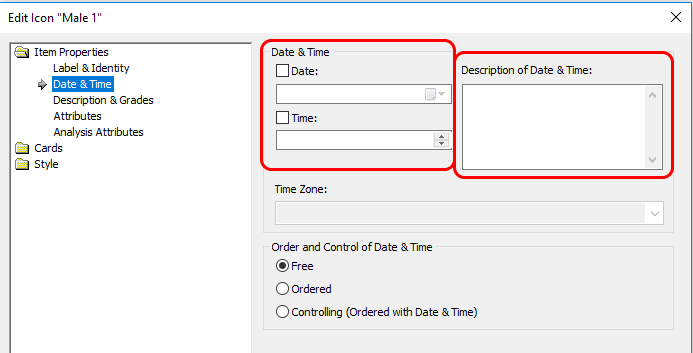


Note: Standard Fields are fields that are duplicated in every entity type and link type.


- When you are on a chart with multiples entities, you must first select all the Entities that have a Date and a Time (if they have none, or if they only have a date or a time, but not both, it will not be possible to attach them to the timeline).
- To this, the easiest is to use the Visual Search

- Create a filter on “Date & Time”, where “Date & Time – is present”
- This will only select the entities that have both a Date and a Date value.
- Note that you can add more filters, for example on the Type, if you want to only select the Persons, or the Accounts.
- Click OK to launch the Search. Check that you do have results.
- Once you have results, right-click one of the selected entities, and select Combined properties.

- Here, you can enable the fact that the selected entities are Controlled (Ordered by date & Time).
- In the previous test, we saw that by default, the entities represented as Icons are “Free” (meaning they are not Controlled by Date & Time). This is not the case when the Entities are represented as Events. This test shows you how.
- We can start with a new blank ANB chart.
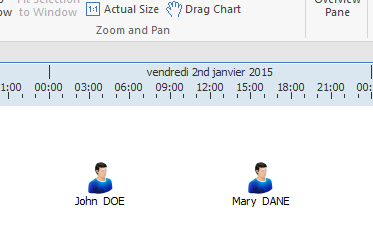
- Search for the 2 Person Entities, and send them to the chart (they are sent as Icons, as this is the default representation).
- As we already saw in the previous test, the icons are “Free”. They are not attached to the timeline.

- And if we look at their properties :

- So, what we can do here is change the representation of the entities, from Icon to Events.
- To do this, we also must select only the Entities that have both a Date and a Time. So, we’ll use again the Visual Search.

- Once the entities are selected, you can now change their representation. In the Style menu,


- Select Representation = Event Frame.
- Check that the Order is set to “Add Order to All Chart Items with Date & Time”
- Click OK to validate

- The entities that have a Date and a Time are now represented with an Event frame. And they are now Controlled by their Date & Time.
- But as for the first test, if there’s a link (with a Date & Time) between these entities, the Link is not attached to the timeline.
- Now, we can compare the 2 options we’ve seen so far, and how they are displayed on the chart.
|
Option 1: Entities as Icons |
Option 2: Entities as Event Frames |
|
|
|


- So,So, while the 2 options are valid, the problem we have with both is that the Links are not attached to the timeline. This is why we’ll see a third option.
- In ANB, the way to represents the Links as vertical lines, attached to the timeline is to have Entities represented as Theme Lines.
- We’ll start on a new chart, and we’ll call again the 2 entities from iBase. By default, they are represented as Icons. And again, we’ll use the Visual Search to select the Entities that have a Date & Time. Then, go to Style – Change Representation.

- Select Theme Line.

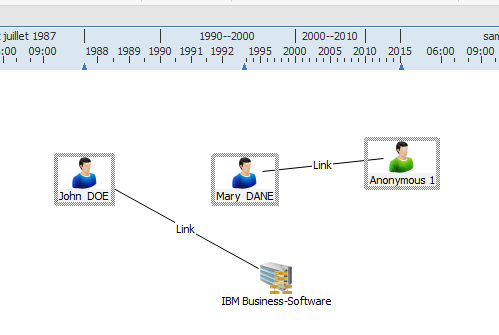
- Here, we can see that each Entity has its own Theme Line, and it is also Attached to the timeline (visible from the little blue triangles at the bottom of the timeline.
- In this situation, if we add a link (with a Date & Time) between these 2 entities, the link is correctly positioned on the timeline.

- With this system, you can position the entities that have a Date & Time on the timeline, and the Links are also correctly positioned on the timeline.
- In iBase, it’s not possible to specify that how you want the entity records to be represented (as Icons, Event Frames or Theme Lines). We saw in the previous 3 options how to can manually change the representation of some of the entity records on the ANB chart.
- But ANB offers a way to choose the representation of the iBase entities when they are sent on the ANB chart. It even offers 2 ways. You can either choose that all the iBase entities are displayed on the ANB chart as Icons or Theme Lines, or you can choose which representation (Icon or Theme Line) to use for each Entity type.
- This is done in the iBase Panel of ANB

- This section allows you to create up to 8 different combinations of ways the entities and links are displayed on the ANB chart.
- With the Combination 1 selected, click the Edit… button

- What is important on this screen is the “Charting Style” part. You see that the value is Association. This means that all the Entity records from iBase are shown on the ANB chart as Icons.
- For the Combination 1 setup, we’ll leave this value, so we can simply click OK or Cancel to exit and come back to the iBase panel.
- Select the Combination 2, and click Edit…

- The Association & Timeline Option screen is displayed.
- On the Charting Style, click the little arrow at the right of Association to display the possible choices

- Select Timeline. This selection means that all the entities from iBase are displayed as Theme Lines or Event Frames.
Note: When is an Entity from iBase displayed as a Theme Line or as an Event Frame ?
If the Date and/or Time property of the Entity is set (this is done in the Charting Scheme definition), then the Entity is displayed as an Event Frame. If not, it’s displayed as a Theme Line. This means that you can also “play” in the Association & Timeline Option screen with the Charting Schemes, depending on what you want to do.
For example, you might have a Charting Scheme where you specified that the Date & Time Properties must be set for one entity type (in this case, the Entities are displayed as Event Frames), and another Charting Scheme where you leave the Date & Time properties for this Entity type empty. In this case, the Entities are displayed as Theme Lines.
- I recommend you to change the name of “Combination 2” to something else. For example “Show Entities for timeline”

- Now, when you select this Association & Timeline option, all the entities from iBase are represented as Theme Lines or Events Frames (depending if their Date & Time properties in ANB are empty or not).
Case 1. In the Charting Scheme CS1, Address entity doesn’t have Date nor Time. Person entity is having Date & Time. One record (Peter Dough) doesn’t have a DoB).

Note the white dot at the top-center of the Event Frame for Peter DOUGH. This means that it doesn’t have both a Date and a Time, which prevents to attach it to the timeline.
Case 2. In the Charting Scheme CS2, Address entity type doesn’t have Date nor Time. Same for Person entity type.

Important: there is no right or wrong representation of the entities. It all depends on what you want to show. In the example of this document, you can ask yourself “is it important to position the Persons on the timeline, based on their date of births ?”.
For some charts, the answer might be Yes. For example, if you want to show that a group of persons were born in the 80’s, and another group of persons were born in the early 2000’s, showing up that you have 2 distinct group of people, and they regroup by age.
For other charts, the answer might be No. For example, attaching some persons to the timeline based on their date of birth, while you are interested in their professional relations, or where they live, what phone they use…, this might not be useful, and it may even be counter-productive, as it may mess up the chart layout.
It is the role of the analyst to know how best represent the information from iBase on the ANB chart, using all the possible options the ANB software offers.
I also recommend you to make tests with your iBase database, creating different Charting Schemes, combining them with the Charting Styles.
- We saw in the previous tests that the Charting Style option in ANB allows you to specify that the iBase entities should be represented as icons or for the timeline (as Theme Lines or Event Frames). But it is also possible to customize the entity representation for each entity type.
- In ANB, when you are connected to the iBase database, you have the Association & Timeline Options. We already have the Combination 1 option that represents the entities as Icons. And we changed the Combination 2 option, renaming it “Show Entities for timeline”. On this example, we’ll work on Combination 3. Select this value, and click the Edit.. button next to it.
- In this screen, we’ll start to rename this option, to give it a better name. We can call it “Custom Entity representation 1”.
- On the same screen, you have the Charting Style option, with 3 possible choices :

- Select “Custom Representation”. The command Custom Representation… becomes available

- Click on it. The following window is displayed :

- For each Entity type, you can define the representation you want to have.
- You have 3 options: Icon; Theme Line and Event frame.

- This allows you to fine-tune the representation of the entities from iBase on your ANB chart.
- For example, you could configure it as :

Note: How do I choose between the 3 representations ?
Generally, you must choose the Theme Line representation for entities like Phones, Accounts, where you have several links with Date & Time between these entities. The Entities themselves generally don’t have a Date & Time, or it’s way less relevant than the links to and from the entities.
You can choose the Event Frame representation for entities that have a Date and a Time, and those date-time is a very important part of what define these entities. We can give as examples Crimes, Events, Meetings… Of course, these entities are linked to other entities, but these links generally don't have a Date & Time (as this information is supposed to be stored in the Entity)
You can choose the Icon representation for … basically all the rest. They can be real world “objects” (People, Organizations, Vehicles, Documents…). They are entities that either don’t have a Date & Time, or this Date & Time doesn’t play a major role in the analysis. And these entities are linked to other entities with links that don’t have Date & Time.
But as explained above, there is no right or wrong way to represent an entity. Make tests, try different combinations of Charting Styles, of Charting Schemes, see which one helps you make the ANB chart easy to understand.
- Here is an example of a simple chart using this new Association & Timeline option configuration :

- In the previous tests, we saw how to configure the way the iBase entities are displayed on the ANB chart, using the Charting Schemes and the Charting Styles. But it is also possible to manually change the entity representation for each entity on the ANB chart.
- To do this, you must of course start with an ANB chart with entities from iBase already present.
- You must then select the entities that you want to change their representation. This selection can be done either by selecting the entities one by one, or using the Visual Search function of ANB.
- Once the entities are selected, go to the Style menu, then click Change Representation

- The following window is displayed :

- The top part (“Change Selected Entities To”) allows you to select how you want the entities to be represented. The most used options are Icon, Theme Line and event Frame.
- The bottom part (“Order”) lets you decide if you want the entities to be sorted by Date & Time along the timeline.
- If you are not sure what the result will be, you can copy the existing ANB chart content to another new ANB chart, and make your tests on this copy, keeping the original ANB chart untouched.
- Again, don’t hesitate to try different things, see if the result suits you.
I hope this long and detailed documentation was clear and allows you to better use the i2 products.
If you have any question, don’t hesitate to contact the IBM i2 Support team, who will be happy to assist you.
Was this topic helpful?
Document Information
Modified date:
28 July 2021
UID
ibm16476232