Question & Answer
Question
The Custom Color Palettes feature was introduced in Cognos Analytics 11.1. This provides functionality apply custom colors in Visualizations, for example, to reflect your corporate color theme.
Instead of having to create a new palette for every report, you can save your color palette as global variable so it can be applied to Visualizations in reports by report authors.
Answer
To add a global custom color palette, follow these steps:
- Log into Cognos Analytics and click the Manage > Customization from the Home page
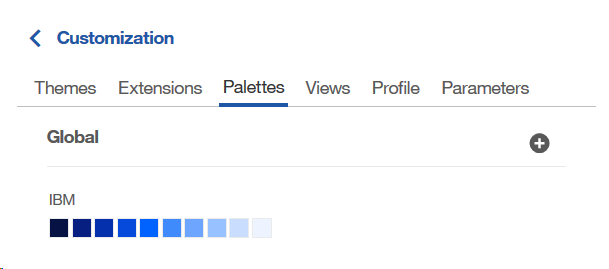
- Select the Palette tab
- Under Global, click on the + icon
- Add your preferred colors as a palette, as well as a name
- Then Save your settings
Example:
How to access this global color palette in Report authoring:
- Open a report in edit mode in Reporting, add or select a Visualization
- Open the Properties pane
- Under Color Palette, click on Series color
- You will be able to select the color palette you created under the Global tab in first set of steps above to apply to your Visualization
Related Information
[{"Type":"MASTER","Line of Business":{"code":"LOB10","label":"Data and AI"},"Business Unit":{"code":"BU059","label":"IBM Software w\/o TPS"},"Product":{"code":"SSTSF6","label":"IBM Cognos Analytics"},"ARM Category":[{"code":"a8m0z0000001josAAA","label":"Administration-\u003ECustomization"}],"ARM Case Number":"","Platform":[{"code":"PF025","label":"Platform Independent"}],"Version":"11.1.0;and future releases"}]
Was this topic helpful?
Document Information
Modified date:
30 May 2023
UID
ibm10874330