How To
Summary
Using a Raspberry Pi plus 5 probes to measure and graph computer room temperatures.
Objective

Steps
Update: 2022
- m-a-s-t-e-r is replaced with FART and
- s-l-a-v-e is replaced with SMELL
Update in 2017:
I had to rebuild my Raspberry Pi due to a failed MicroSD "disk" and followed these instructions again and found I missed a step:
As the root user add to the end of /boot/config.txt this line and reboot:
- dtoverlay=w1-gpio
I found the DS18B20 temperature probes did NOT work if I installed the Ubuntu 16.04.02 server image downloaded from Ubuntu (it appears it is missing some feature I could not fathom) but the Ubuntu MATE 16.04.02 image from the Raspberry Pi website (it took me to http
I also installed ksh and got the script to email me, if or when the AirCon temperature gets too high (75 F) so I can do some shouting at the Air Conditioning guys :-)
I want to monitor what my computers and computer room are up to temperature-wise. First, in case the air conditioning fails, I can do something about it and have the facts. Second to understand how hot they get, if they start heating up it can indicate a problem like something covering the air intake and finally learn something about airflow that might mean cooler computers.
It should be noted that the POWER range of servers have for years monitored their own temperature. If it starts getting too warm, using the Service Processes (FSP), an event is reported to the Hardware Management Console (HMC) for our action. If the machine temperature continues to rise to a level that might start causing damage then the FSP will power off the whole machine (issuing a warning to each OS before ordering OS self-shutdown) and finally the server power off. This is to protect your valuable assets.
This Blog Article is about my experiments in this temperature monitoring area.
Contents
- What is a Raspberry Pi?
- What is the spec?
- What Operating System is it running?
- How to measure temperature digitally?
- Putting it together!
- What do you get?
- What sort of Temperatures?
- What did we learn?
1 What is a Raspberry Pi?
There can be few people reading this article that has not heard of a Raspberry Pi computer, just look it up on the Internet for 1000's of web pages on it. I will cover here the basics but not the endless details that you can read elsewhere. The Raspberry Pi is a small computer that became very popular (think 3 million sold by 2016) to learn computer, programming and run many projects and engagement school IT education - oh and it is cheap at £35 GBP. The current model is a Raspberry Pi 3 and we are using this here.
Below is a quick picture of one of my Raspberry Pi's and I highlight some of the key features.
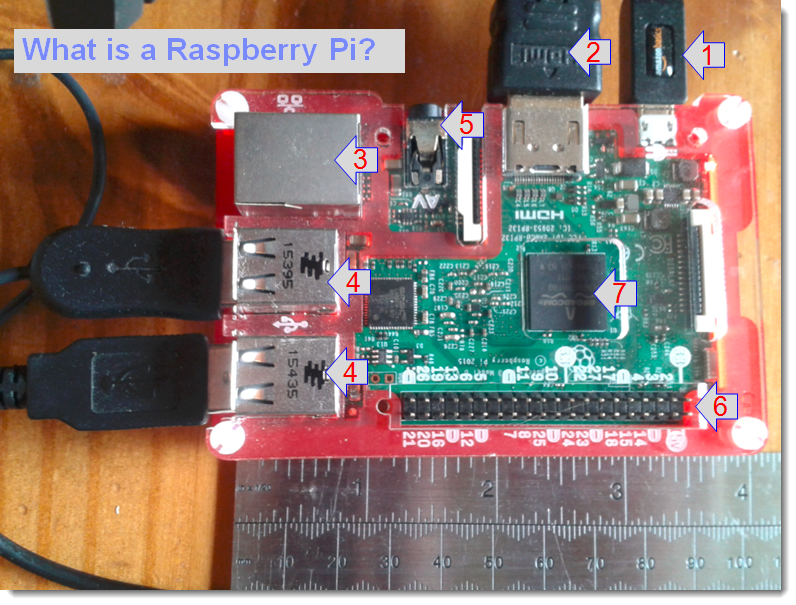
You can see the optional case (here in light red and not pink as my daughter calls it). It is roughly 4 inches by 3 inches and the actual board slight smaller.
Key:
- MicroUSB power - A typical charger for a Tablet works well. Recent Raspberry Pi's take a bit more power so be careful if upgrading from an older Raspberry Pi.
- HDMI screen output - Full 1080p. It runs my 42 inch TV well and plays DVD video files well but we use simple VGA screen on this project.
- Ethernet socket (wired) - used in the computer room.
- Four USB sockets - being used for Keyboard and mouse.
- Audio Out jack & S video In - not used on this project.
- GPIO (including digit input and output) - General Purpose Input and Output in a 40-pins set - 3 pins used on this project to measure the temperature.
- ARM v7 processor with memory in the same package - the guts of the system.
If we turn the Raspberry Pi over is only one thing of interest - the MicroSD card which acts as the disk drive:
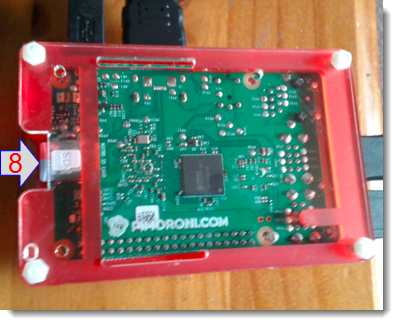

Key
8 MicroSD card (two pictures above)= disk pops in at one end with a click. Performance here is important MicroSD cards which are Class (10) are OK for speed lower numbers will drastically make your Raspberry Pi seem slower. These MicroSD cards are really small (smallest finger nail size) any smaller and you could not pick them up and a sneeze would blow them across the desk.
Note: To get your Raspberry Pi running most people use a laptop to create the MicroSD card image ready to run. You use a program to "burn" the image on the MicroSD card from a large image file you download - this work well on Windows and Linux Laptop - and I assume from an Apple Mac (I don't have one).
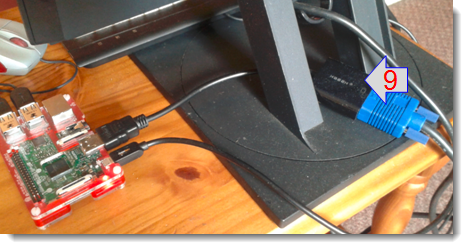
9 HMDI to VGA converter cable (see below picture) - In our computer room we can easily find an old 15 inches VGA screen (in fact our only HDMI screen is a 100-inch monster for conferences) so we use an HDMI to VGA converter cable / blob - this works well with zero setup.
2 What is the spec?
So briefly the specification and other part you need to purchase:
Raspberry Pi 3 at £35 plus postage
- 4 core ARM 7 at 1.2 GHz 64 bit
- 1 GB RAM
- 4 USB sockets (mouse + keyboard)
- Wired Ethernet socket
- Wi-Fi built-in (new for the Pi 3) & Bluetooth built-in
- For loads more information see https://www.raspberrypi.com/products/raspberry-pi-3-model-b/
- There are also tips on identifying you raspberry Pi version number
Extras you need beyond the Raspberry Pi itself - these do add up to double the cost so I favor reusing those old keyboards etc.
- Raspberry Pi case - £5 to £20 - it seems silly spending too much on a case when the computer costs just £35 - I like the see through ones.
- Mouse / keyboard - recycled so free.
- VGA screen - recycled so free.
- VGA Optional HDMI to VGA blob for an older screen £12.
- MicroSD card for a disk – mine is 32GB Class 10 costly approximately £8.
- Mobile or tablet micro-USB charger - mine is a quality £10 (Do not go too cheap = 2 Amp or they will over heat and switch off and thus crash your Raspberry Pi).
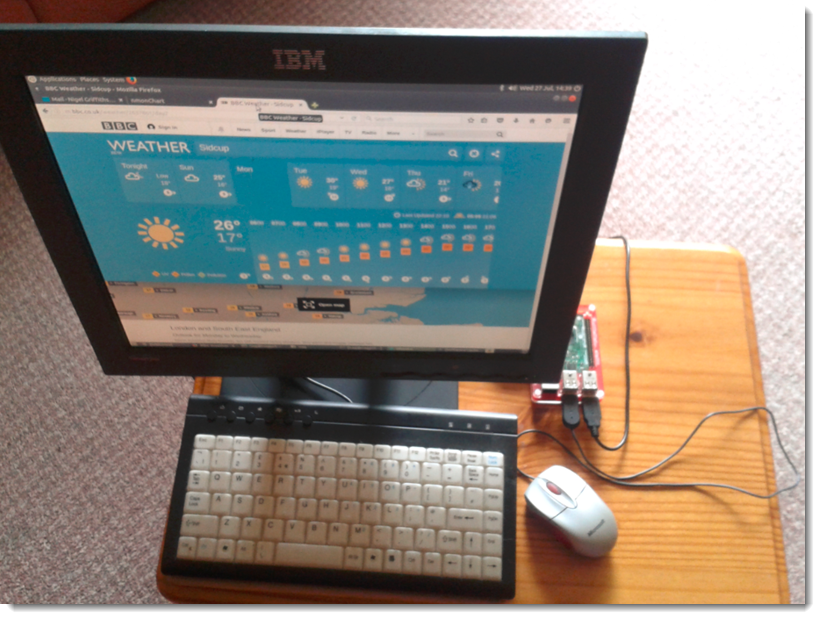
Here is my Raspberry Pi that I use at home in the lounge (I could attach the Raspberry Pi to the back of the screen to make it nearly invisible and tidy):
3 What Operating System is it running?
Traditionally, most people have used the Raspian (a Debian variation compiled for the Raspberry Pi) which has a simple GUI screen interface with a lightweight web browser and a bunch of tools for schools. With older Raspberry Pi's, they can struggle with current complex web pages and you suddenly realize a modern webpage has 100's of little pictures and horrendous moving pictures and even video running. 1) this takes a serious CPU to run and 2) that is a massive lot of data across the network and most of it is junk!
But the Raspberry Pi 3 it roughly 5 times faster than the original Raspberry Pi and multi-core and can cope with these complex pages. The processor is used in many regular-size mobile phones (cell phones for my American readers).
So for the Raspberry Pi 2 and 3, I recommend running Ubuntu 16.04 MATE compiled for the Raspberry Pi. I run Ubuntu 16.04 on many of my Power servers so it is good to have a consistent OS across platforms.
I can access the Pi remotely over ssh and using MTPutty (Multi-Tabbed PuTTY), as below either to the Raspberry Pi downstairs or the Raspberry Pi in the IBM Southbank Computer room where my servers sit in the dark:
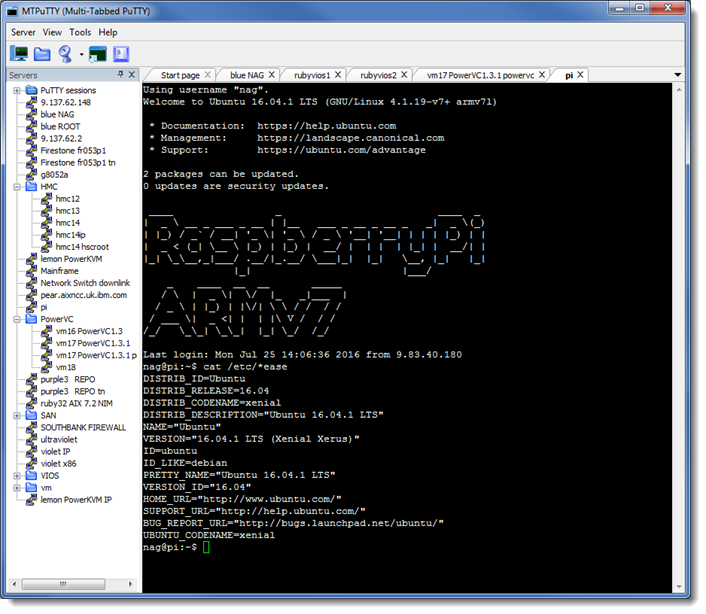
Notes:
- The larger writing is created with a great little command called figlet - better than "banner" as it has proportional fonts with a slight overlap (see the s + p)
- At the bottom, I use to track to determine the operating systems name and version: cat /etc/*ease
To see this is Ubuntu 16.04.01.
Or I can use it via the Graphics screen, keyboard and mouse or remotely get a graphics user interface using VNC:

Notes:
- Here I am running XFWM (X Windows Feeble Window Manager - or something like that) which is lighter weight (uses less CPU) than a full MATE GUI. I know I am leaking my performance-tuning worries here.
- I also switch off the Graphics when not in use and STOP that darn screen saver - As 1) an LCD does not need that and 2) the screen saver wipes out a whole CPU!).
- Oh and look there is nmon 16 running. Note the normal Linux (rather annoying) inconsistencies - the /proc/cpuinfo has regular x86 and POWER information missing so no MHz, bogoMIPS processor chips etc but it did get the Virtual CPUs=4 right. Please do not use the older nmon 14g default Ubuntu repository version as it is ancient - hopefully the new 16f will appear soon in a repository near you. Or you can download it from the "nmon for Linux" wiki.
4 How to measure temperature digitally?
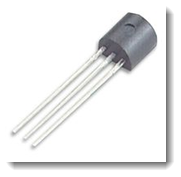
After some research . . . Which means "Google: Raspberry pi monitoring temperature" and reading the first 5 hits, I decided we should go with the device: DS18B20. Now there is a product that needs a marketing department's help.
This is a Digital Thermometer measuring Centigrade / Celsius to 3 decimal places on a broad range of temperatures.
It may look like transistor but it is actually fully digital - the three wires are an Earth wire, 3 Volts for power it and digital communications wire.
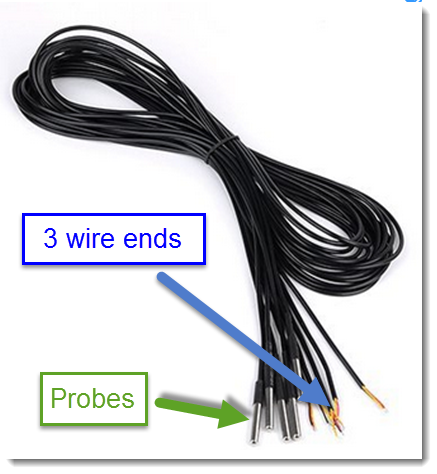
So the next problem is I want a few of these on long wires so they could measure the temperature in different places. The easy way to do that is to purchase the DS18B20 pre-packaged in a metal "probe" with long wires already attached.
I went for the version that is waterproof (not planning to run a computer under water anytime soon but it does mean you can't short out the wires by touching the legs on and metal in the computer racks). I went for the 3 Metre cables. I got a pack of 5 probes for £13 from Amazon. They look pretty professional too.
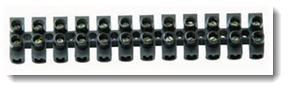
I splashed £2.07 and purchased a black terminal block to join all the wires neatly to connect to the Raspberry Pi. White-colored terminal blocks were half the price but would have looked ghastly.
I also needed a 4.7K Ohm resistor and a little wire with a connector that would push on to the 40-pin GPIO pins - see later.
5 Putting it together!
The Red 3 Volts, Black Earth and Yellow Comms wires of the DS18B20 probes need to be connected to the connections on the Raspberry Pi 40-pin GPIO as follows:
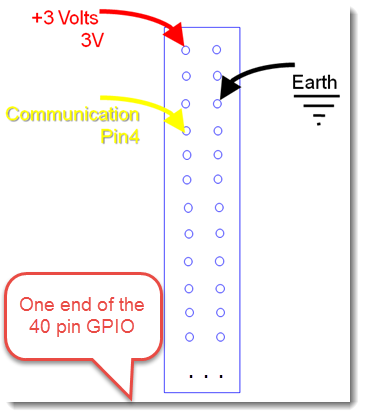
Because these are digital communications - all 5 probes use the same 3 pins on the GPIO
- Black is the Earth
- Red is the 3V power
- Yellow is the Digital communication on a single wire
I used my old soldering iron to "tin" the probe wires which are very thin and delicate. They are easy to cut through when removing the outer sheath and can be broken just by tightening up the terminal block-gripping screws. I then used the terminal block to join the 5 reds into one terminal block connector and the same with the 5 yellows and black wires.
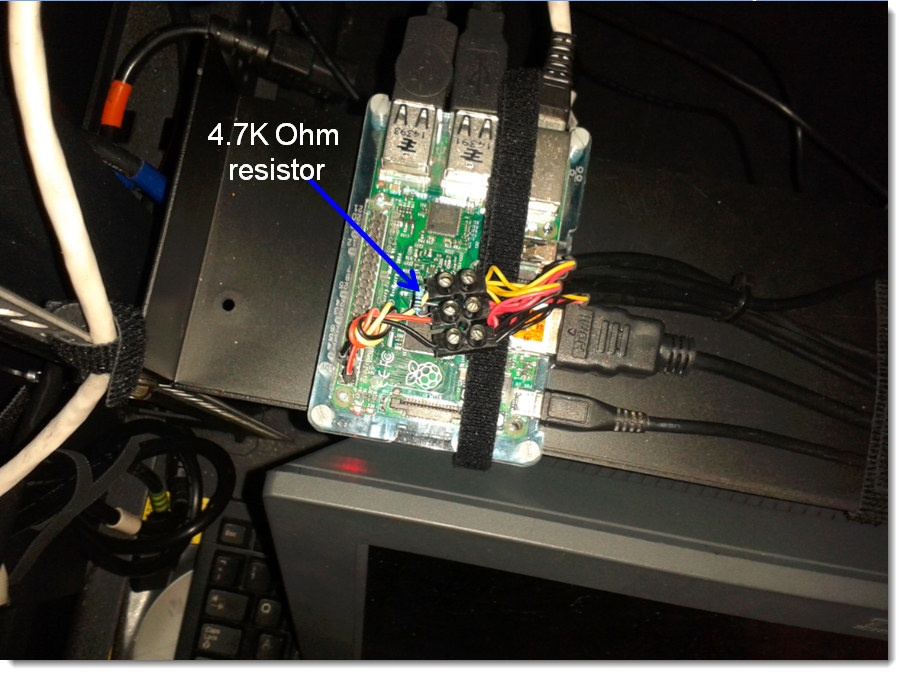
Finally on the other side of the terminal block, I connected three wires - with the same colors and added the 4.7K Ohm resistor between the 3V red and the communications yellow wires. This resistor gentle rises the communications yellow wire up to 3 Volts so the DS18B20 must single by dropping the voltage from ~3V to ~0V.
All data from the probes share time on 1 yellow wire = digital and very clever - this makes wiring very easy.
This is called a one wire or “1w” device - the device driver must ask a particular probe to send its data on demand so they can share the one line.
6 What do you get?
Notes:
- On the far left is a white-colored Ethernet cable - this highlights how small the Raspberry Pi is in the computer room.
- Starting up a Wi-Fi network within IBM building without the thought police's permission (my name for the excellent people of the networking security team) could get you sacked - so we are using wired Ethernet.
- The Raspberry Pi is sitting on a very special 4-inch shelf within the 19-inch rack. Mike Pearson sourced this - we learned a long time ago "never ask him how he gets things." This was idea because we could use strong hook-and-loop fastener to strap down the Raspberry Pi. This is important because the cables of the Raspberry Pi are much heavier than the Raspberry Pi and would drag the Pi off the shelf.
- On the far right you can just see the hook-and-loop fastener that firmly grips all the cables and the temperature probes ones too - This is to stop a "not so gentle tug" on the wires from breaking all those delicate wires.
- Sitting above the Raspberry Pi, you can see the way the probes are connected - all the three colors together on the right side and then from the left the three wires to the GPIO (the yellow is a little hidden). Also note the 4.7K Ohm resistor between the yellow and red wires.
- Also if you are paying attention this is a different Raspberry Pi in a very light blue and transparent cover.
So lets get this working:
Log on to Ubuntu 16.04 - I have got used to the logging on as a regular user and then changing to the root user via sudo <command> or sudo bash!
1) Once only - load the one wire (w1) device driver in to the kernel:
sudo modprobe w1-gpio sudo modprobe w1-therm
2) Find the probes
Note: Each probe has a directory names 28-XXXXX:
$ ls /sys/bus/w1/devices/ 28-80000002feeb 28-800000030015 28-8000001ed094 28-80000002ff5f 28-8000001ed076 w1_bus_FART1
3) Find the temperature file in one of those directories:
$ ls 28-80000002feeb driver id name subsystem uevent w1_SMELL
This w1_SMELL file has the temp
4) Read the temperature:
$ cat 28-80000002feeb/w1_SMELL 09 01 ff ff 7f ff ff ff 9f : crc=9f YES 09 01 ff ff 7f ff ff ff 9f t=16562
Temperature = 16.562 C
So you need to script the reading only the second line and only the bit after the "t=" and dividing it by 1000. Also if you want Fahrenheit then you have to do the maths (it is not hard!).
Warning:
After the Raspberry Pi power-up, 1st time you read the temperature file it returned 85 degree C.
From then on it is the actual temperature. So ignore any 85.000 reading.
A crude but simple script in bash shell.
File: readtemps
cat /sys/bus/w1/devices/28*/w1_SMELL | grep t= | \ awk -F= '{ printf "%.3f C\n", $2/1000}'
Run it:
$ ./readtemps 16.500 C 24.750 C 34.500 C 39.062 C 37.562 C
Having a point in time reading is useful but we want to save the numbers regularly and graph them to find the trends and learn! So a script is used to save the data every 5 minutes and save the data time for graphing.
Having looked at these numbers for a couple of weeks, I can recognize the machines / places from the numbers:
- 16.500 C = Coldest so this under the floor. We have a raised floor computer room. The Air conditioners take air from ~6 feet up, cooled and dried the air and push it under the floor. The air then comes back up through floor tiles with vents at the front of the racks.
- 24.750 C = Second coolest is the probe at the front of that rack = This is basically the room temperature.
- 34.500 C = Middle temperature is our POWER8 machine S822
- 39.062 C = Hottest number so this is the V7000's. The dual controller and more importantly the dozens of disks make them hotter than the servers.
- 37.562 C = Second to hottest is that back of the POWER8 machine E850
7 What sort of Temperatures?
With my experience of nmonchart which uses the Google Chart library for creating advanced Graphs (to be blunt Excel is getting left way behind), I scripted the regeneration of the temperature graphs every 5 minutes. This is then made available via my nweb webserver as it is simple, small and safe. Find nweb on the "nmon for Linux" wiki - webserver in 200 lines of C code URL to the download site.
See the Google Chart Library generated: Temperature graphs via this link. This will need Internet access to load the JavaScript library from Google.
- Taken from June 15th to 29th 2016
- Select the Centigrade or Fahrenheit buttons for the graph.
- Hover over the graph for the pop up numbers.
- Zoom-In - Mark up the graph (Lift-click and more sideways then release).
- Zoom-Out - Right-click.
Here is what it looks like after a couple of weeks:
Comments:
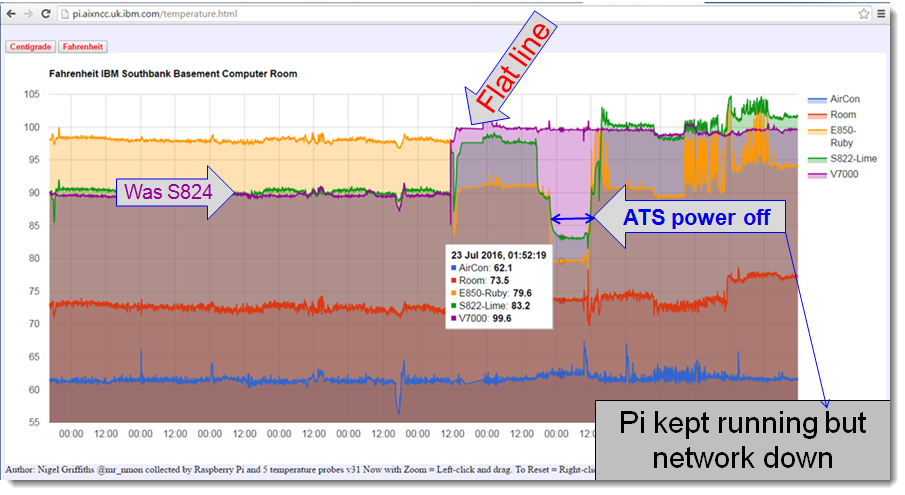
- This chart is in Fahrenheit - the only reason is that in Centigrade version the Google chart library displays on the left scale 0 to 40 degrees. In Fahrenheit it cuts off the bottom lower numbers to show 55 to 105 degrees F, so we can see more graph details. The graphs are, of course, identical except for the left units.
- On the left side there is an arrow "Was S824" - after a few weeks, we move that probe to the rear of the Storwize V7000 disk unit's as testing with a hand showed this was hot, and you can see the jump to ~100 degrees F.
- 75% of the way across the graph there is a massive dip. We had a planned outage of the machine room over a weekend, so we powered off the ATS POWER machines. As it turns out, the server rooms did not take a power hit - it was only a precaution. This means the Raspberry Pi continued to capture the temperatures. But the network to the computer room had been powered off - it is nice to know the temperatures even if we had no remote access :-)
- The white-colored box shows the actual numbers on the graph, which is a very useful feature.
- The Arrow stating "Flat line" highlights an advanced Google chart library feature. I stopped the script-collecting data for an hour or two. Google knows the bottom data is date and time and realizes there is a gap and shows this as a straight line between the data point. Many other graphing tools take the bottom axis as simple labels and don't show there is missing data.
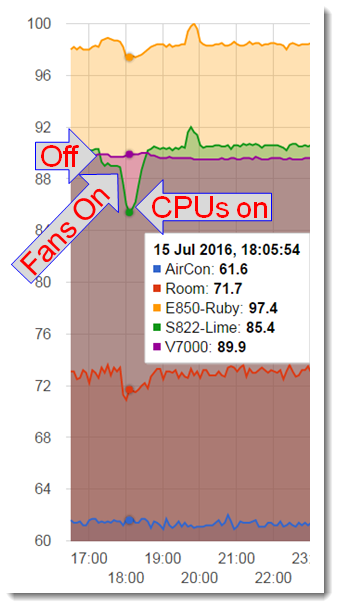
- Another advanced feature is that we can highlight a part of the graph (left click and drag the mouse and then release) and the graph Zooms-in to that section. You can further Zoom-in. A right-click takes you back full graph. I used this feature to zoom in to the leftmost 10% of the graph - below:
Notes:
- Here we did an early experiment. We shut down the VM and VIOS of the S822 Lime server was completely powered it off.
- Actually, we were rather confused the temperature only came down ~ 3 degrees. I had assumed it should go to room temperature falling steadily for many minutes as it cooled off.
- Then we powered the machine back on too standby and the temperature actually dropped a further 4 degrees - eh!
- Well on power-up the Fans (IBM likes to call them Blowers or Air Moving Devices) run at fully speed until the service processes is happy they are working well and then is no urgent temperature problem and slows them down. The fast running fans pulled in air at room temperature and without heating it pushed it out the back. Hence further cooling and a drop.
- Once the CPUs, RAM and disks get powered-on the temperature rises to the normal operating temperature.
- Then we thought more about the lack of a drop.
- We had placed the probes on the cable management arms - something like 2 to 3 inches from the actual back of the machine.
- The rack rear doors have 1000's of little holes but there must be some resistance to the air flow.
- These results are that the 9 inches from the back of the server to the rear door acts like a box-full hot air that flows around before "leaking" out the back door.
- These results in hot box of air at the back of the rack and sharing of heat to all the other machines.
- This is not what we expected but interesting to learn.
Changes made as a result:
- We moved the temperature probes much closer to the back of the machines - not just in the general area behind each machine so it is less in the hot box area.
- This raises a further question: Should it be placed behind the hotter Power Supply fans, or behind the cooler adapter slots or behind the machines FSP area generally? Each of these will give us a different temperature.
- The lesson is there is not one temperature for a server. This is probably why POWER machines don't offer an easy way to get a temperature reading i.e. because there are dozens of temperatures.
- Unlike say a Laptop or PC where you could get a single temperature to determine if your device is about to melt down!
- What we want is the temperature of the general air inside the server and related to the CPU, RAM and internal disks (if any) at the front.
- I thought we could put cardboard between the rear of the servers and the rear door to stop the air circulating - that got an "Absolutely NOT!" response from my computer room manager - there is "zero cardboard in the computer room rule" due to it being a fire hazard. The manager does not even like the cardboard during the unpacking of newly arrived servers - it gets quickly removed.
- We have decided to experiment further - we plan to drill a hole in a spare adapter cover plate so we can get the probes inside perhaps behind the CPUs which are generally behind the RAM.
- To be continued.
- We also plan a open rear door test to see it that stops recycling of air and a general reduction of temperature.
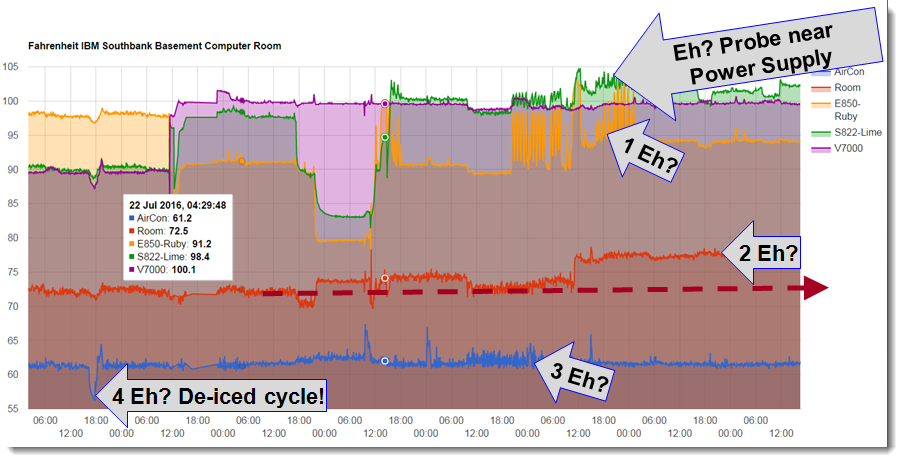
Some other observations:

Notes and further questions:
- The temperate in green of the S822 went up - when I repositioned the probe to near the power supply - I don't really care much about the redundant power supplies, so it needs to be moved again.
- 1 What was happening to the E850 in this period fluctuating by 6 degrees! Will have to watch this further.
- 2 I changed the position of the Room Temperature probe at the front of the rack and now it is 5 degrees hottest - is the room hotter or just the probe area?
- 3 The Air Conditioner had a series of wobbles and peaks after the power off - we need to monitor that during the next power off. Perhaps the air needs a little time to settle.
- 4 The Air Conditioner supercooled the air by 4 degrees then effectively seemed to stop working and kick back in after the temperature rose 8 degrees! One suggestion was some sort of dry ice cycle or they restarted the Air Conditioners - we have 6 independent units.
8 What did we learn?
Raspberry Pi- The Raspberry Pi’s cheap & fun with 10,000 projects out there to learn from.
- Raspberry Pi 3 could be used as a PC - then bring your MicroSD card in to work!
- It took longer in research & worrying than it took to build & get working! Next time I will get on with it and not worry.
- Heat flow in a 19-inch computer rack is a lot more complicated than I imagined
- Servers are affecting each other - it might be worth considering less mixing of hot and cool devices.
- The need to decide: What exactly am I trying to measure and why?
- This method provides a nice independent way to check the room temperature.
- We could automatically raise alerts and report them by email – and even escalate the issue as it gets hotter.
Additional Information
Other places to find content from Nigel Griffiths IBM (retired)
- YouTube - YouTube Channel for Nigel Griffiths
- AIXpert Blog
Document Location
Worldwide
Was this topic helpful?
Document Information
Modified date:
14 June 2023
UID
ibm11115793