News
Abstract
Collection Services Package
Content
Collection Services package
Note that for any of these charts, if you have collected by small intervals this may show up as a solid color. Use the slider to zoom in and click on the checkbox in the legend to remove any metric that may be overtaking the chart and preventing the visibility of smaller numbers.
View the table as chart/table so that you can see the metrics that are calculated.
Select the blue oval "SQL" button on the top right of any view to see the SQL used to generate the data being displayed
This is the Collection Services package tree. Detail on some of the folders is given below or as a link to its own page:
- CPU Utilization and Waits Overview
- CPU Utilization by Thread or Task
- Resource Utilization Overview
- Job Statistics Overviews
- Waits
- CPU
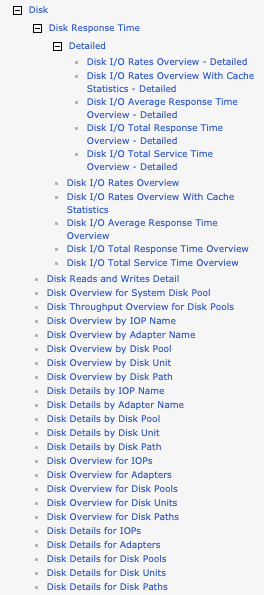
- Disk
- Physical Disk I/O
- Synchronous Disk I/O
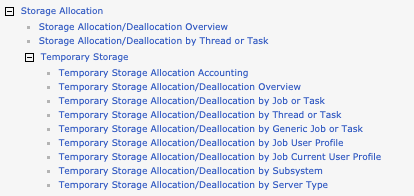
- Storage Allocation
- Memory
- Page Faults
- Logical Database I/O
- Virtual I/O
- Communications
- 5250 Display Transactions
- Physical System
- Java
- Timeline
- Workload Group
- Collection Services Database Files
Disk
Storage Allocation
- These charts display data from QAPMJOBMI
JBPGA: Total number of 4096-byte units of temporary and permanent storage that have been allocated by the thread since the thread started.
JBPGD: Total number of 4096-byte units of temporary and permanent storage that have been de-allocated by the thread since the thread started.
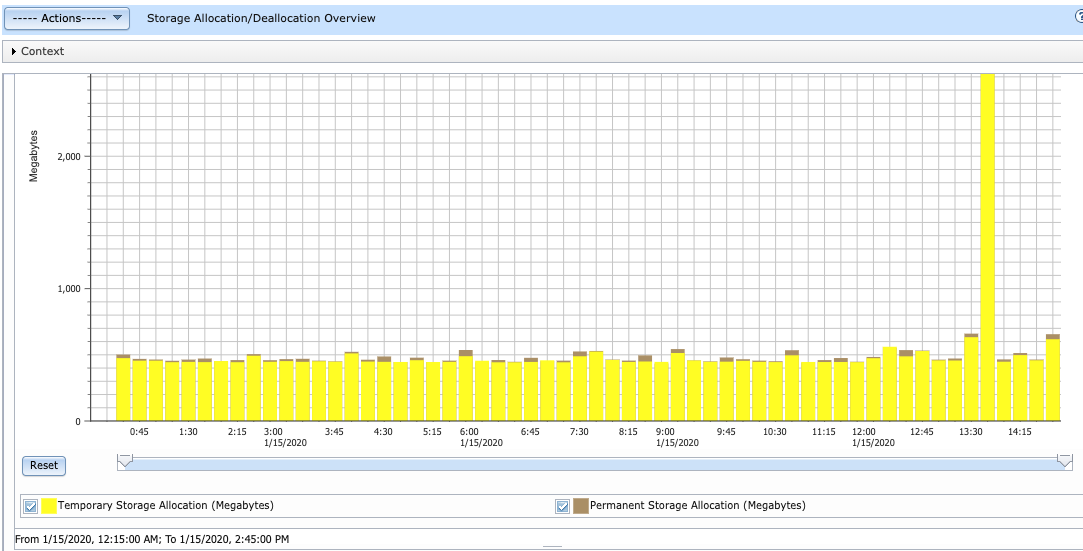
Storage Allocation/Deallocation Overview - This chart shows allocation and deallocation of the temporary and permanent storage for all contributors over time for the selected collections. Use this chart to select a time frame for further detailed investigation.
Storage Allocation/Deallocation by Thread or Task -This chart shows allocation and deallocation of the temporary and permanent storage, net frames requested by thread or task. Use this chart to select a thread or task for viewing its storage statistics over time.
View 1: Storage Allocation/Deallocation by Thread or Task Sorted by Allocation
View 2: Storage Allocation/Deallocation by Thread or Task Sorted by Net Storage Requested
Memory
Memory Pool Sizes and Fault Rates
- View 1: Memory Pool Sizes and Fault Rates (001-004)
- View 2: Memory Pool Sizes (All Pools)
- View 3: Fault Rates (All Pools)
Memory Pool Activity Levels
- View 1: Memory Pool Activity Levels and Ineligible Transitions Per Second (001-004)
- View 2: Memory Pool Activity Levels (All Pools)
- View 3: Ineligible Transitions Per Second (All Pools)
DB and Non-DB Page Faults
- View 1: DB and Non-DB Page Faults Overview (All Pools)
- View 2: DB Page Faults (All Pools)
- View 3: Non-DB Page Faults (All Pools)
Drilldown to:
Memory Metrics for One Pool
- View 1: Memory Metrics Overview for One Pool
- View 2: DB and Non-DB Page Faults for One Pool
- View 3: DB and Non-DB Pages Read/Written for One Pool
Note: The Memory charts showing multiple pools do not handle a change of pools (adding or removing) within the collection time-frame. When the pools are changed, the collection should be cycled to provide data that can be accurately viewed. The memory pool perspectives assume a fixed set of pools for each interval in the dataset. This is true for Memory Usage by Pool as well as Fault Rates (All Pools) and others.If the pools change within the collection time-frame, you may notice that the hover text information does not match up with the x-axis label for the date/time or interval number. An easy way to see if this is the problem, is to switch to the table view and see if the number of rows for each interval changes within the collection. (If for example the first interval has 4 rows (one for each pool), and the 2nd interval has 5 rows (a 5th pool was added). The results of the chart will be skewed.
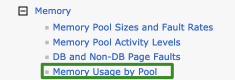
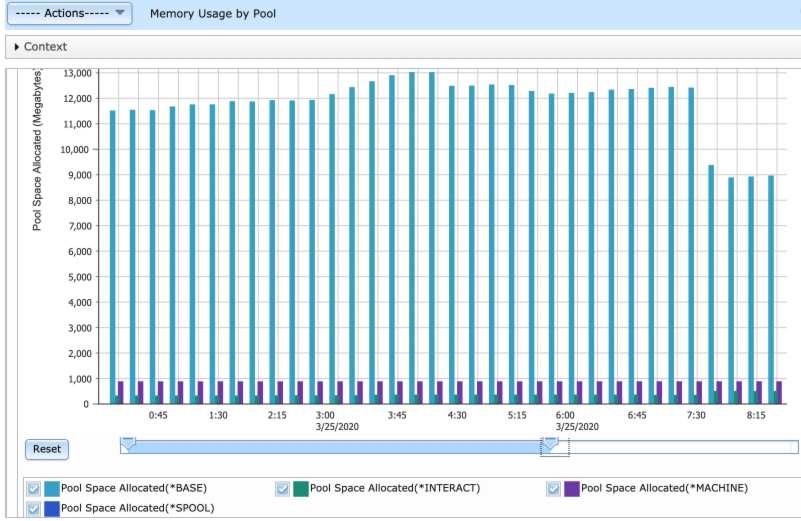
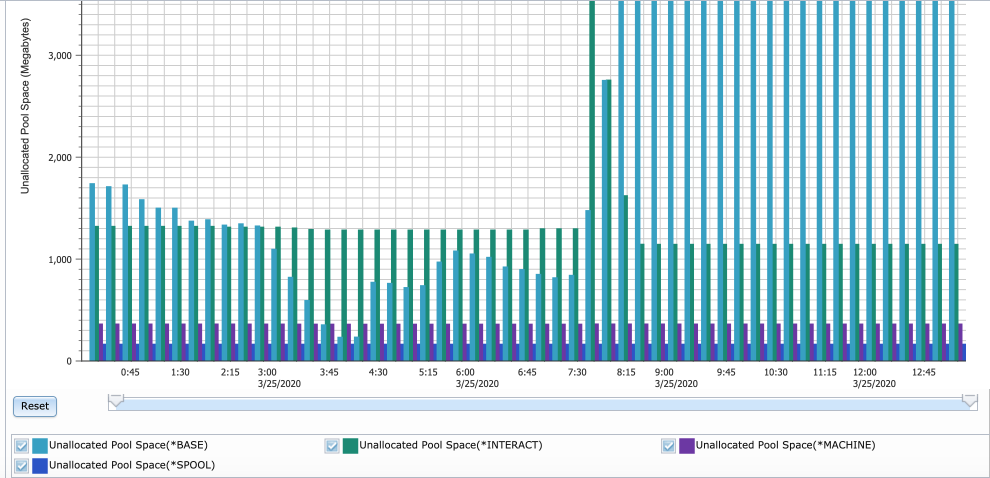
- View 1: Memory Usage by Pool
-
Each pool is shown as its own bar for each interval. The value charted is the space ALLOCATED for that pool during that interval. Each pool is labeled with its name. You can click on the "SQL" button on top right of the graph to see what the SQL is that generated the data. Then you can go to KC and look at the metrics in QAPMPOOLB to find out which numbers are charted
-
This chart is showing POSIZB[pool size]-POUNALB[unallocated pool space] = Pool Space Allocated
-
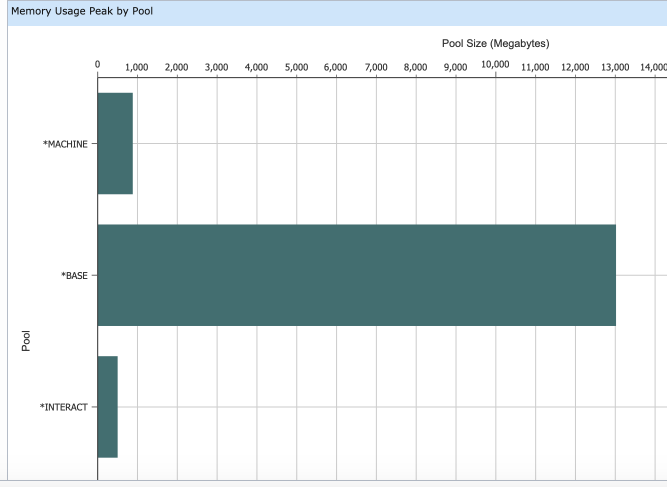
- View 2: Memory Usage Peak by Pool
- Each pool is shown with its peak size during the full time of this collection - maximum pool space allocated
- Each pool is shown with its peak size during the full time of this collection - maximum pool space allocated
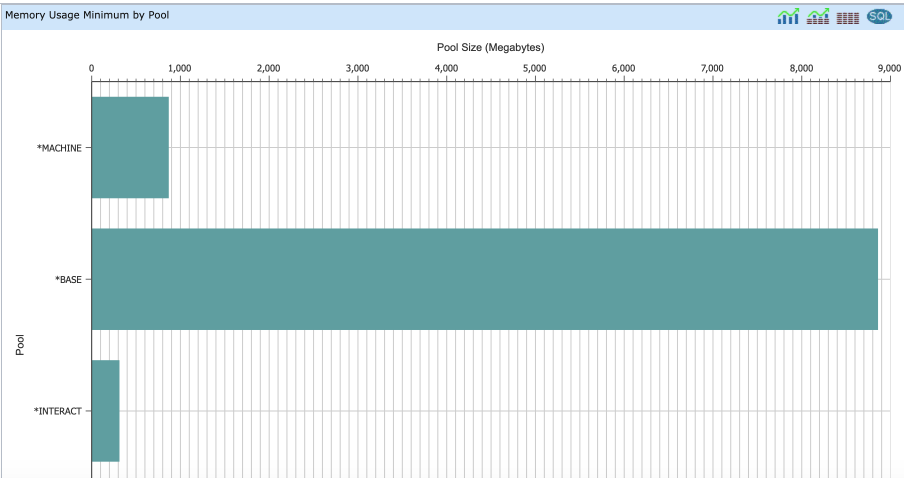
- View 3: Memory Usage Minimum by Pool
- Each pool is shown with its minimum size during this entire collection time - minimum pool space allocated
- Each pool is shown with its minimum size during this entire collection time - minimum pool space allocated
- View 4: Memory Available by Pool
- Each pool is shown as its own bar for each interval. The value charted is the space AVAILABLE for that pool during that interval. Each pool is labeled with its name. POUNALB[unallocated] = available
Java
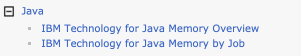
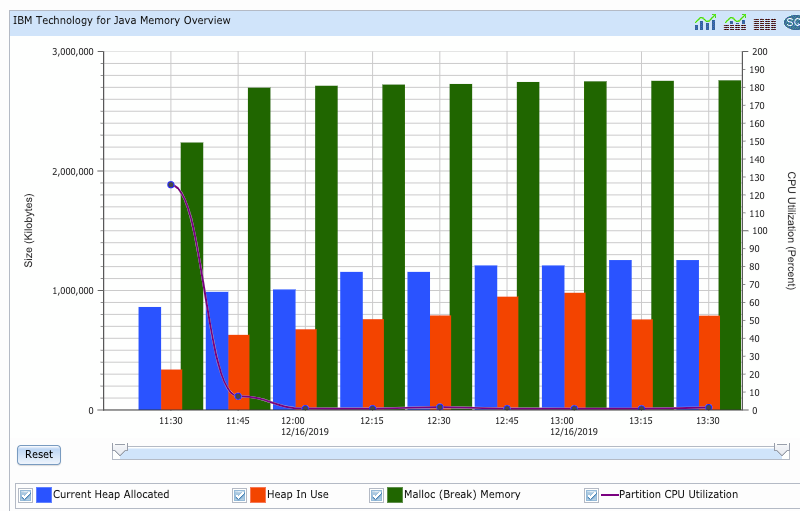
- IBM Technology for Java Memory Overview
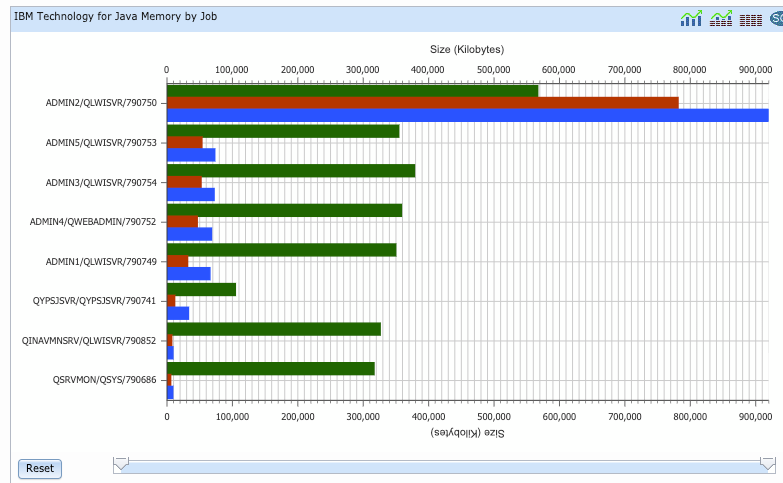
- IBM Technology for Java Memory by Job: This chart shows average heap sizes and memory over the entire time of the collection broken down by job. Use this to find out what jobs are using memory so you can investigate them further.
- IBM Technology for Java Memory for One Job: A drill down from "IBM Technology for Java Memory by Job". It allows you to look at the heap and memory usage over time for one selected job.
Timeline
These features require Performance Tools LPP option 1 (PT/1 option 1)
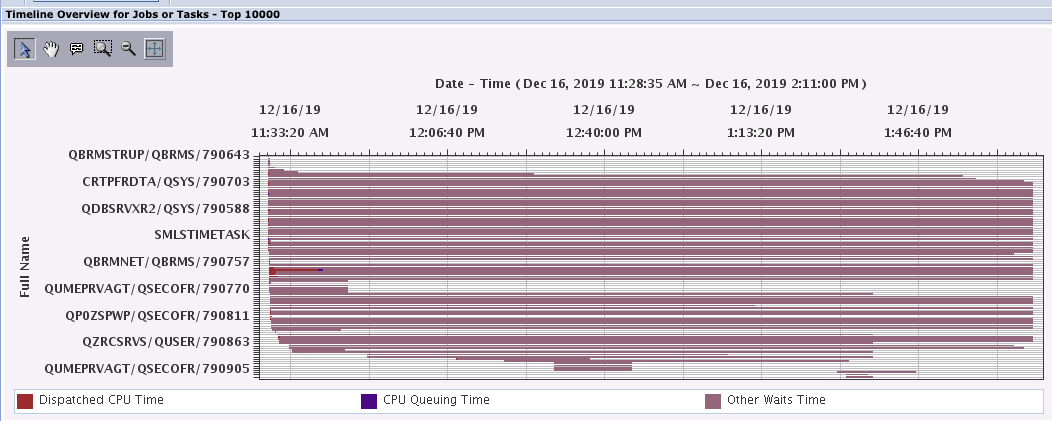
Timeline Overview for Jobs or Tasks
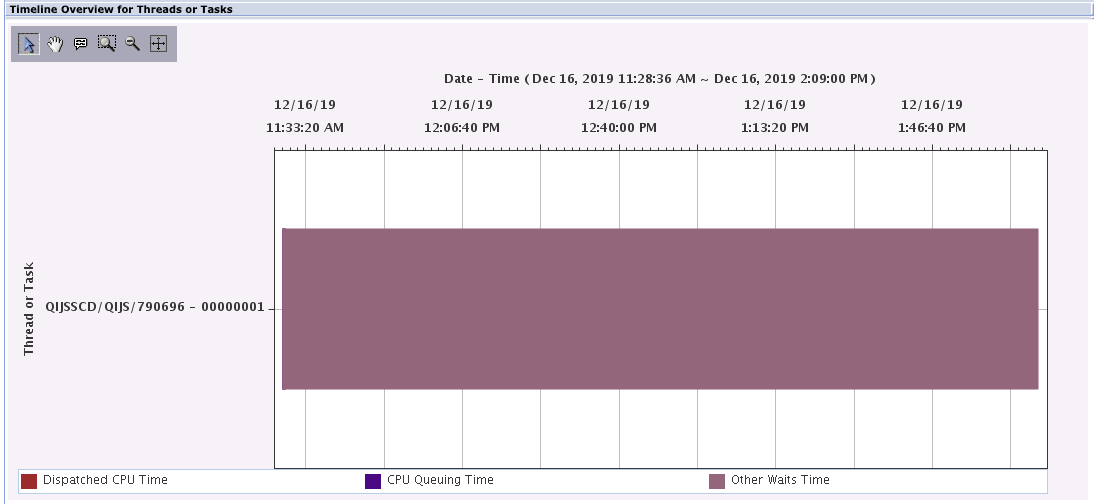
Timeline Overview for Threads or Tasks
This chart shows the timeline overview for threads or tasks. It gives you an easy visual context of the (run time) length for jobs as well as the concurrency of workload on the system. Select a thread or task for viewing its detailed run and wait contributions.
Collection Services Database Files
-
QAPMCONF - Decodes the Configuration and System Information database file QAPMCONF
-
QAPMETH - One record per line per port per interval. With the introduction of link aggregation, line names may no longer be unique within an interval. Port resource name should be used to uniquely associate records across intervals.
Was this topic helpful?
Document Information
Modified date:
24 May 2024
UID
ibm11127721