Troubleshooting
Problem
A report contains a column visualization that has several values on the x-axis. When report is run to HTML, all the values are visible. When report is run to Excel, not all values are visible.
Cause
Excel output does not support percentages (%) for the Size property of the chart.
Resolving The Problem
Set the size and overflow property to a unit of measure as opposed to a percentage.
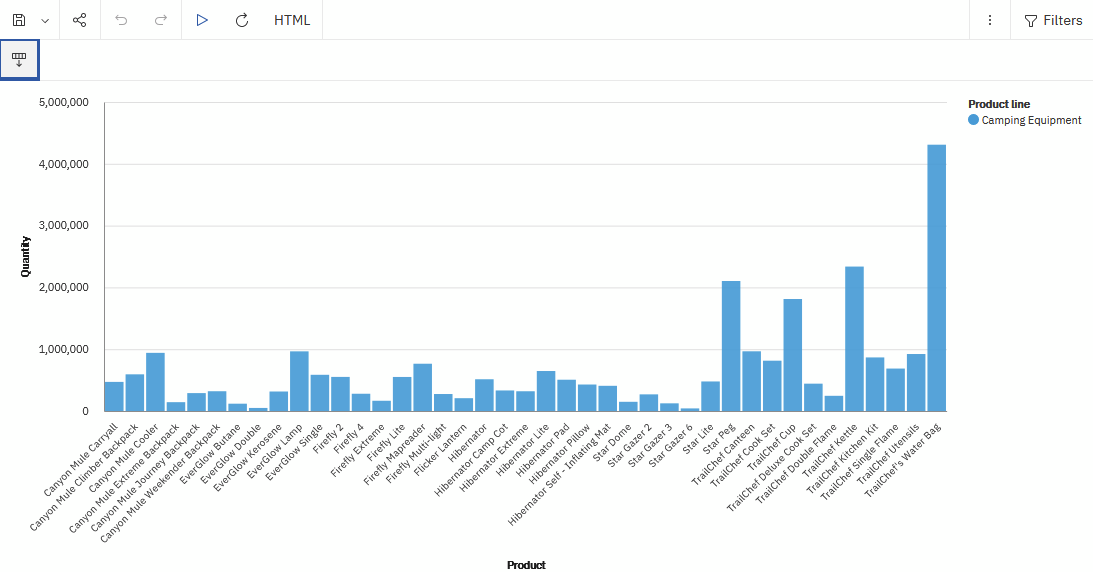
Sample report output in HTML with Size - Width property set to %100:
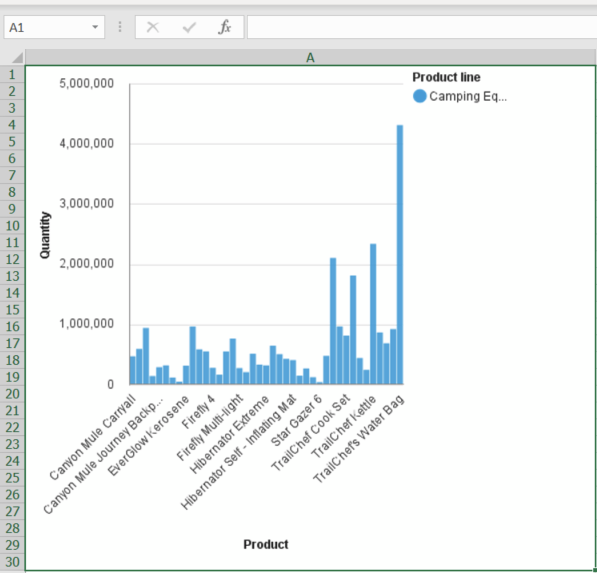
Same report exported to Excel:
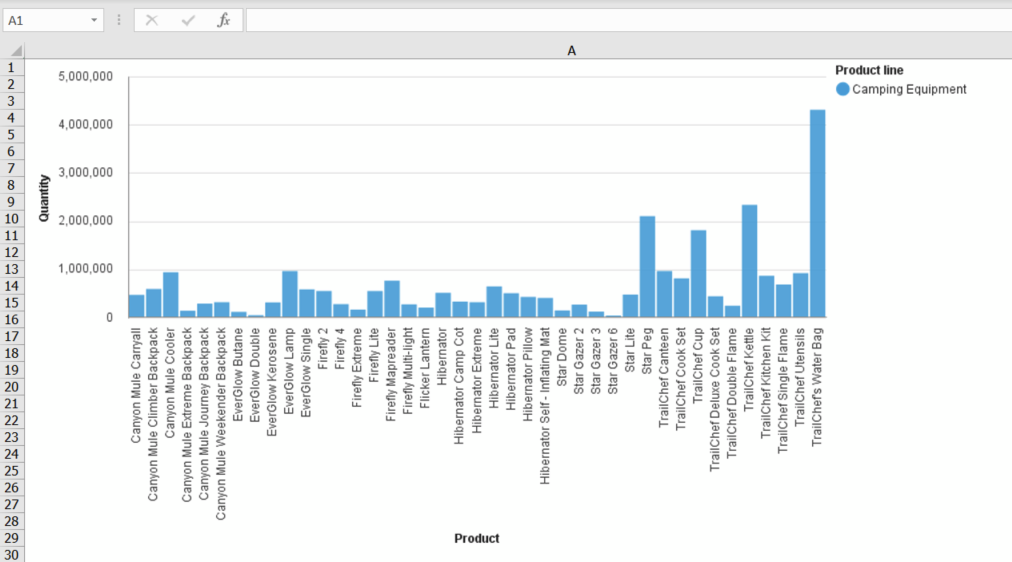
Size - Width property for the visualization modified to 10 inches (in):
Document Location
Worldwide
[{"Type":"MASTER","Line of Business":{"code":"LOB10","label":"Data and AI"},"Business Unit":{"code":"BU059","label":"IBM Software w\/o TPS"},"Product":{"code":"SSTSF6","label":"IBM Cognos Analytics"},"ARM Category":[{"code":"a8m500000008d78AAA","label":"Reporting"}],"ARM Case Number":"TS009592048","Platform":[{"code":"PF025","label":"Platform Independent"}],"Version":"All Versions"}]
Was this topic helpful?
Document Information
Modified date:
06 June 2023
UID
ibm17001669