Release Notes
Abstract
Business Dashboards for Apps
Content
MaaS360 announces availability of Business Dashboards for Apps (Apps Inventory) in the portal. The Business dashboards for Apps provides reporting data across managed and non-managed apps for devices enrolled that are in the customer account.
Contact IBM MaaS360 Customer Support Team to avail Business Dashboards for Apps. These dashboards is listed in MaaS360 portal under Reports > Mobile Apps as Apps Inventory.
- Basic mode customers get Overview and Usage Overview Business Dashboards for Apps only.
- Advanced mode customers get Overview, Usage Overview, Execution Overview, Usage Trends, and Execution Trends reports.
- SPS only mode customers get Usage Overview, Execution Overview, Usage Trends, and Execution Trends reports.
Accessing Business Dashboards for Apps
Pre-requisite: To avail Business Dashboards for Apps capabilities, contact IBM MaaS360 Customer Support team. On contacting the support team, Analytics setting is made available for your customer account in the Setup > Settings (Single Setting' page) > Administrator Settings.
Steps:
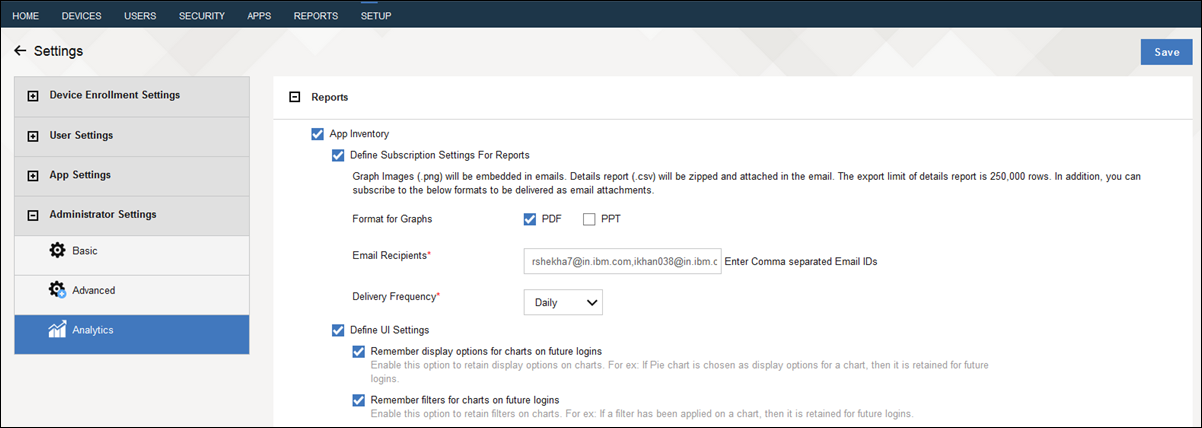
Enable App Inventory and select the following settings and Save.
- Define Subscription Settings for Reports: This setting is applicable for both basic mode and advanced mode customers to subscribe for all Business Dashboards for Apps. Graph Images (.png) is embedded in emails. Details report (.csv) is zipped and attached in the email. The export limit of details report is 250,000 rows.
>> In addition, you can subscribe to the Graph formats such as PDF, PPT, or both.
>> Enter one or more comma-separated recipients emails address.
>> Choose Delivery Frequency for report subscription such as daily, weekly, or monthly and the day on which you want to receive Business Dashboards for Apps email.
Viewing an example of Analytics administrator settings in Settings page
- Define UI Settings: Enable this option and following settings to retain display and filter options on Business Dashboards for Apps charts on future logins. Note: The setting is available for only for Advanced mode customers and SPS only mode customers.
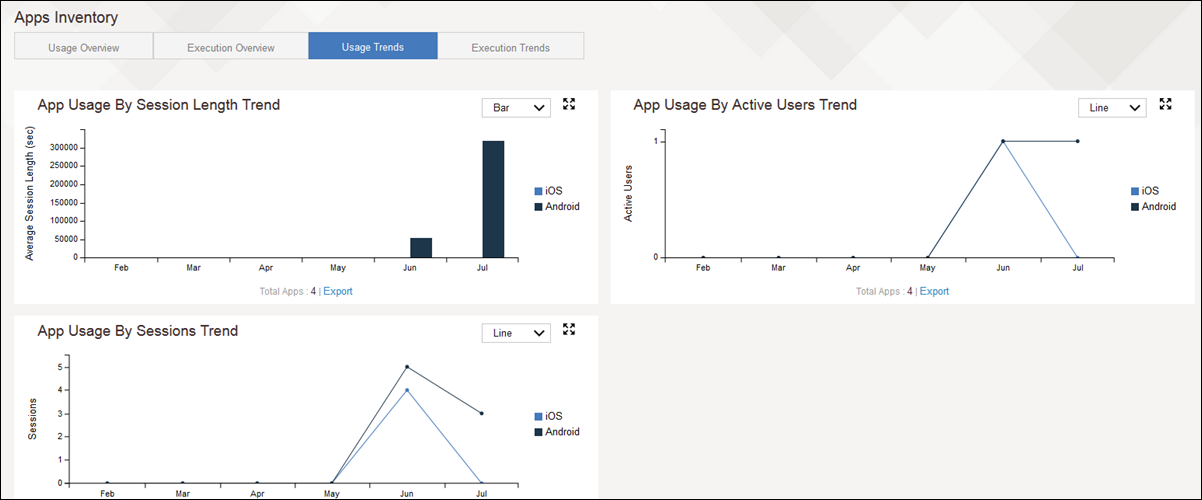
>> Remember display options for charts on future logins: Choose the type of chart such as Bar, Line, Pie, or Area chart view of the report you want to use.
Example: In Usage Trends, Bar chart is chosen for App Usage By Session Length Trend and Line graph for App Usage By Active Users Trend and App Usage By Sessions Trend. The chart selection for the reports is saved and remains same for future logins until any changes are made in the selections.
Viewing an example of saved display chart selections in the Usage Trends report
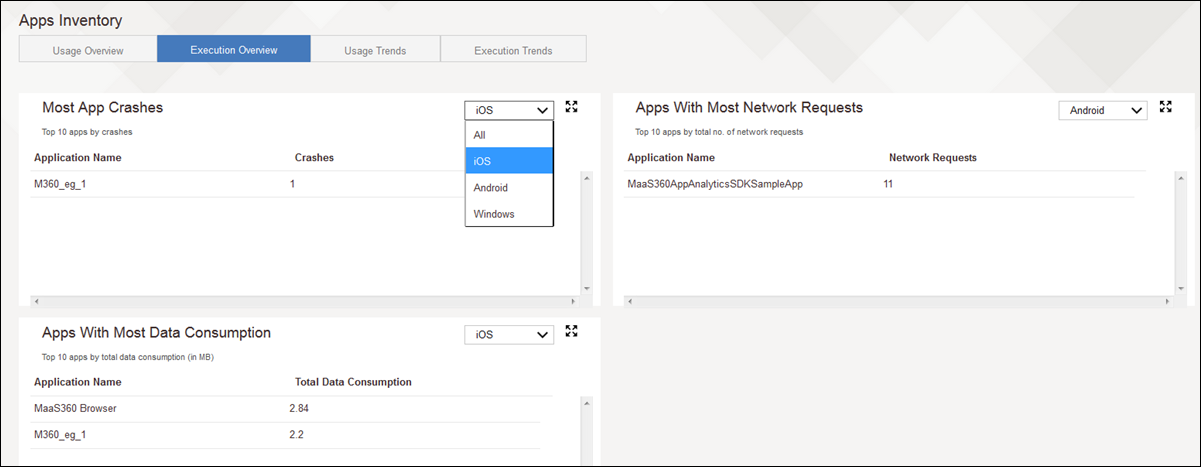
>> Remember filters for charts on future logins: Choose the type of platform such as iOS, Android, Windows, or All platform to filter chart reports.
Example: In Execution Overview, iOS platform is chosen for Most App Crashes and Apps with most Data Consumption, and Android platform for Apps with most Network Requests. The chart filter for the reports is saved and remains same for future logins until any changes are made in filters based on platform.
Note: The saved settings are applicable for chart types settings, filter options (based on platform), and any filters in the expanded view of Business Dashboards for Apps.
Viewing an example of saved filters for chart selections in the Execution Overview report
Was this topic helpful?
Document Information
Modified date:
29 November 2018
UID
ibm10738831