Troubleshooting
Problem
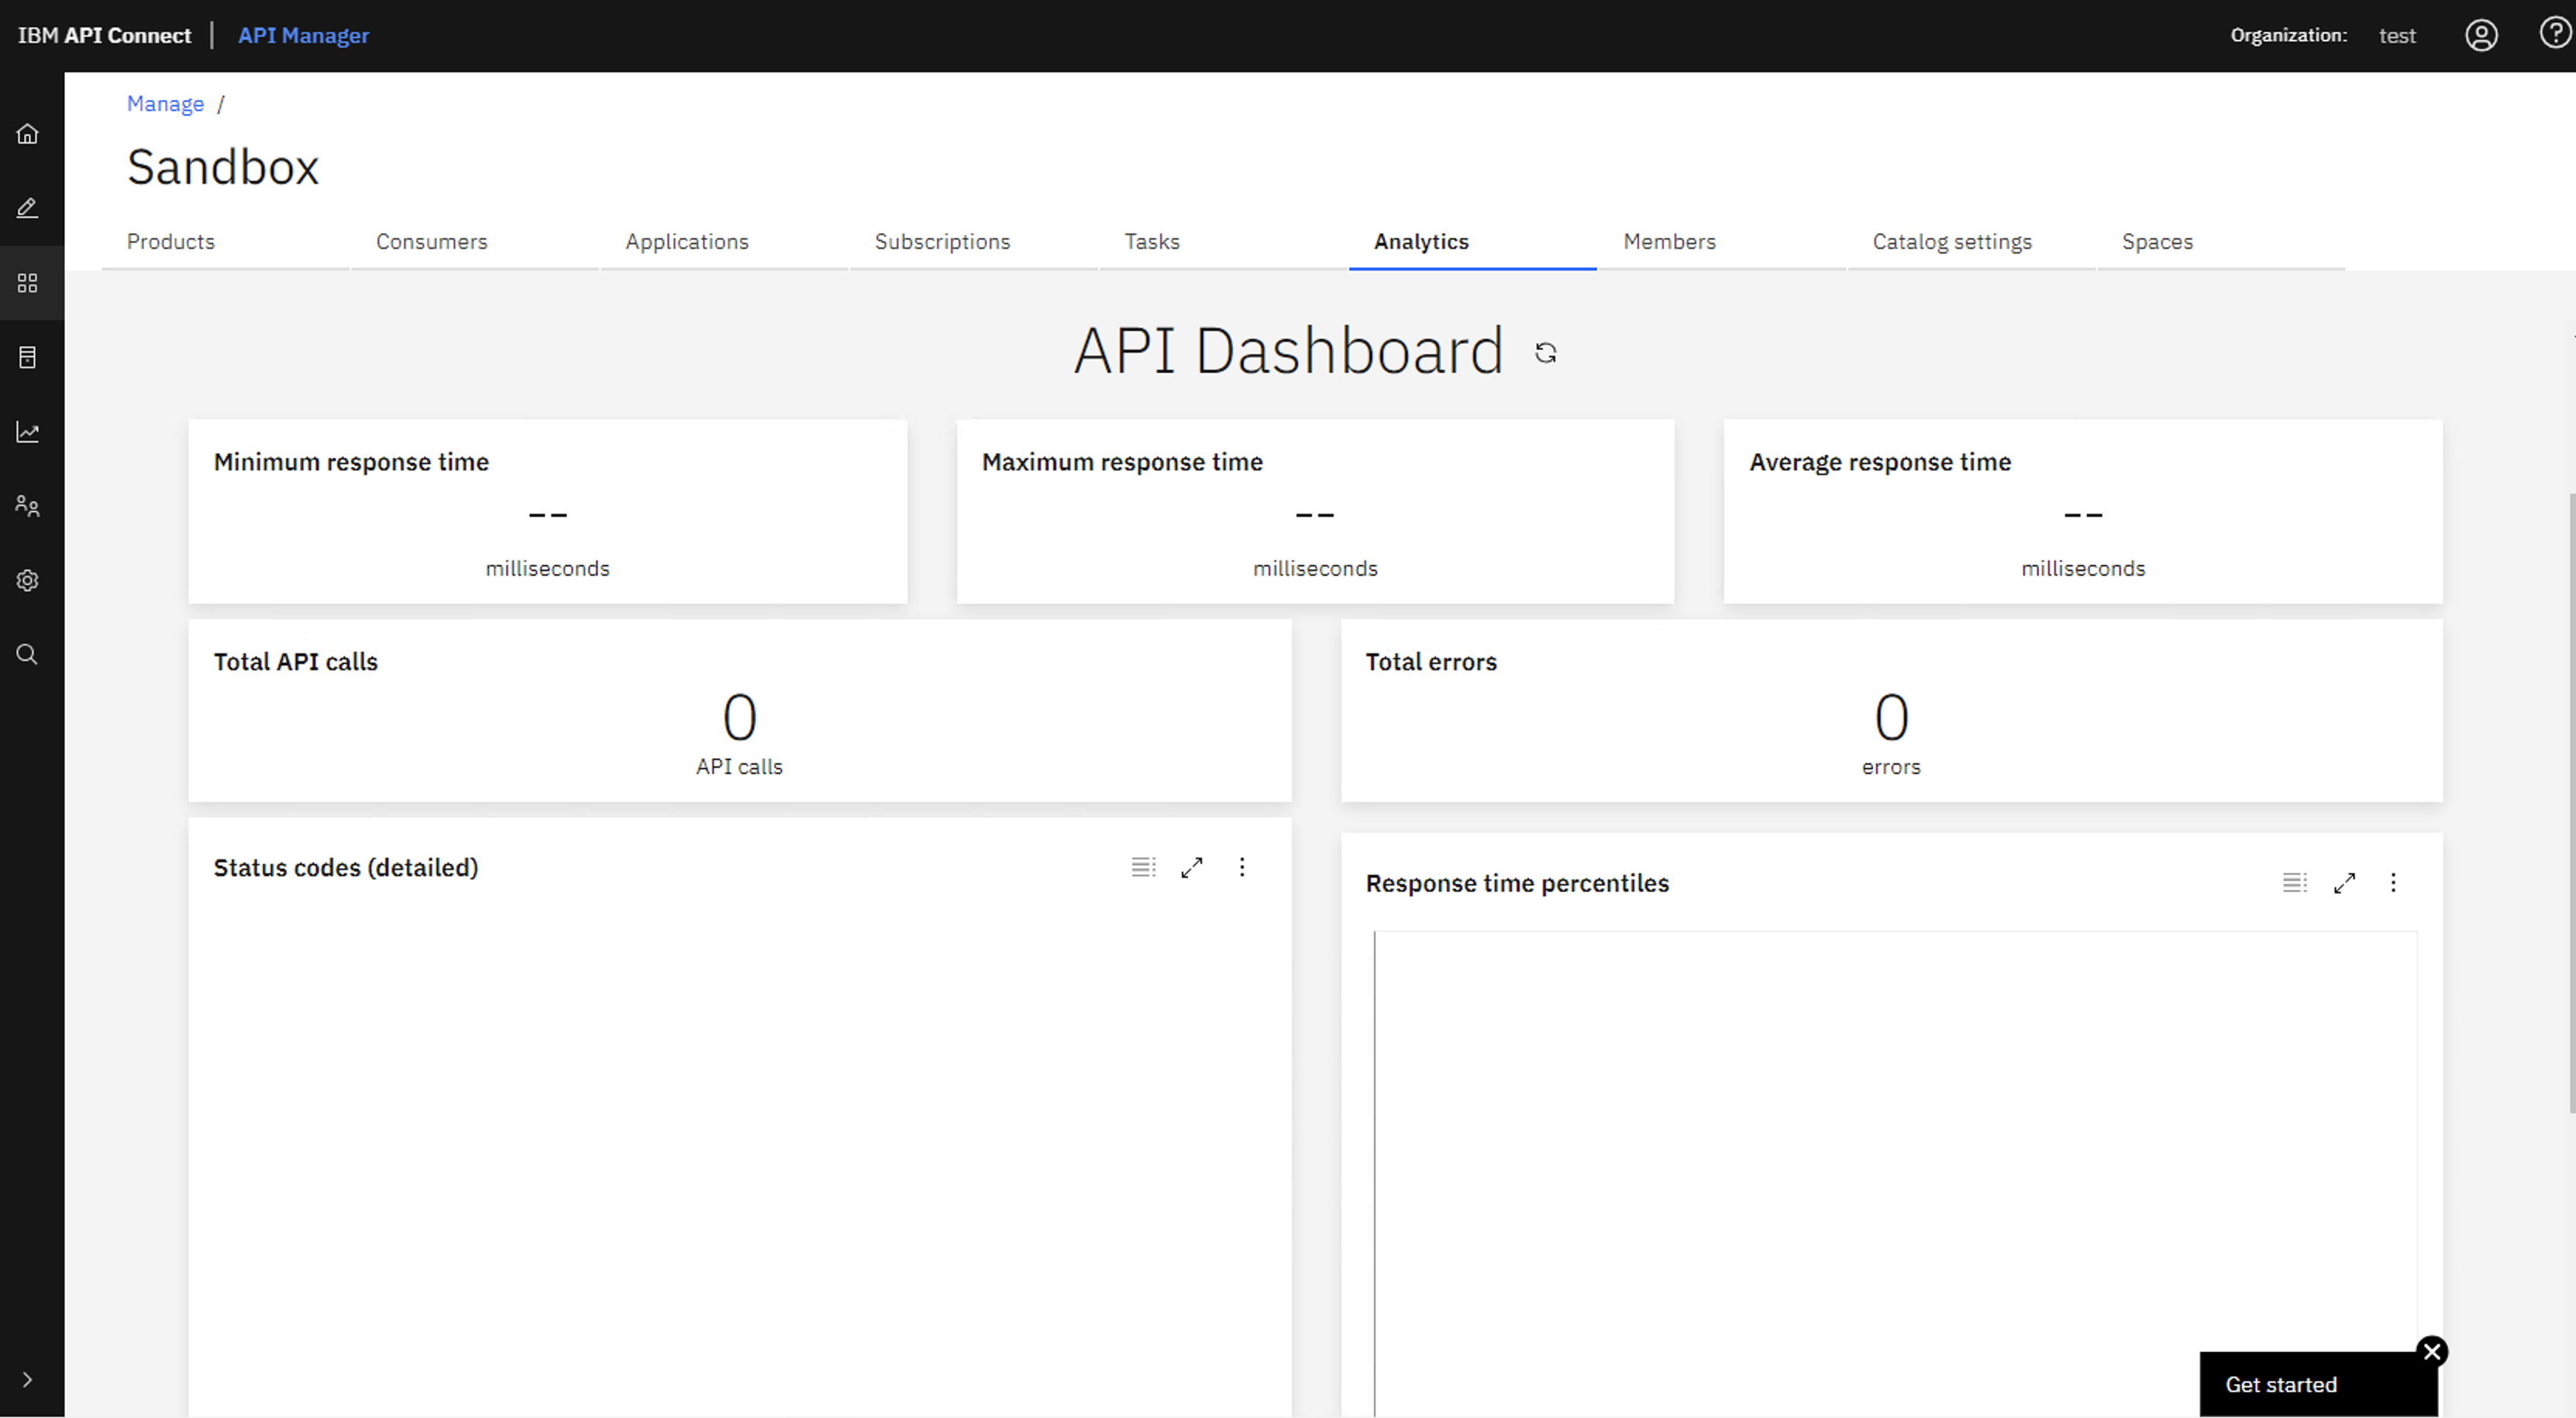
In API Connect releases before 10.0.5.2 users might see that the analytics dashboard doesn't display as expected, with fields unavailable in the API Dashboard.
Symptom
Visibly users see gray boxes where the Minimum Response time, Maximum response time, Average response time, Total API Calls, and Total errors fields are located
It might work for some catalogs and not others because of how the data differs in those catalogs.
For example, a catalog with 20 applications and a few API calls might display, but another catalog with 2000 applications has a larger database query and might not display.
Cause
An issue exists in the OpenSearch queries that are created in the analytics backend in API Connect releases before 10.0.5.2.
Diagnosing The Problem
Affected users see the analytics storage pod logs show log messages like:
[WARN ][r.suppressed] [analytics-storage-1] path: /apic-api-r/_search, params: {size=0, index=apic-api-r}

org.opensearch.action.search.SearchPhaseExecutionException:

    at org.opensearch.action.search.AbstractSearchAsyncAction.onPhaseFailure(AbstractSearchAsyncAction.java:644) [opensearch-2.0.0.jar:2.0.0]

    at org.opensearch.action.search.FetchSearchPhase$1.onFailure(FetchSearchPhase.java:128) [opensearch-2.0.0.jar:2.0.0]

    at org.opensearch.common.util.concurrent.AbstractRunnable.run(AbstractRunnable.java:54) [opensearch-2.0.0.jar:2.0.0]

    at org.opensearch.common.util.concurrent.TimedRunnable.doRun(TimedRunnable.java:59) [opensearch-2.0.0.jar:2.0.0]

    at org.opensearch.common.util.concurrent.ThreadContext$ContextPreservingAbstractRunnable.doRun(ThreadContext.java:798) [opensearch-2.0.0.jar:2.0.0]

    at org.opensearch.common.util.concurrent.AbstractRunnable.run(AbstractRunnable.java:52) [opensearch-2.0.0.jar:2.0.0]

    at java.util.concurrent.ThreadPoolExecutor.runWorker(ThreadPoolExecutor.java:1136) [?:?]

    at java.util.concurrent.ThreadPoolExecutor$Worker.run(ThreadPoolExecutor.java:635) [?:?]

    at java.lang.Thread.run(Thread.java:833) [?:?]

Caused by: org.opensearch.search.aggregations.MultiBucketConsumerService$TooManyBucketsException: Trying to create too many buckets. Must be less than or equal to: [65535] but was [65536]. This limit can be set by changing the [search.max_buckets] cluster level setting.

    at org.opensearch.search.aggregations.MultiBucketConsumerService$MultiBucketConsumer.accept(MultiBucketConsumerService.java:150) ~[opensearch-2.0.0.jar:2.0.0]

    at org.opensearch.search.aggregations.InternalAggregation$ReduceContext.consumeBucketsAndMaybeBreak(InternalAggregation.java:181) ~[opensearch-2.0.0.jar:2.0.0]
Resolving The Problem
The issue is addressed in fix pack 10.0.5.2 with a code fix to change the queries used in the analytics backend to be more efficient. There are no other workarounds for this issue.
Related Information
Document Location
Worldwide
[{"Type":"MASTER","Line of Business":{"code":"LOB45","label":"Automation"},"Business Unit":{"code":"BU059","label":"IBM Software w\/o TPS"},"Product":{"code":"SSMNED","label":"IBM API Connect"},"ARM Category":[{"code":"a8m50000000CeBlAAK","label":"API Connect-\u003EManagement and Monitoring (MM)-\u003EAnalytics"}],"ARM Case Number":"TS014004085","Platform":[{"code":"PF025","label":"Platform Independent"}],"Version":"10.0.5"}]
Was this topic helpful?
Document Information
Modified date:
11 September 2023
UID
ibm17031617