This article is going to cover the basics only as the details can found in the following two places:
The AIX Workload Manager Redbook
Highlights:
- Published in June 2001
- 350 pages
- Chapters: The need for WLM, functions, administration, performance tools, manual assignment, application programming interface, sizing with WLM, practical experience, and then a series of appendix.
- Many famous AIX technical people are named in the writers and contributors list. Amazingly, not my name but I covered WLM in technical conferences shortly after the book was released.
- Download: https://www.redbooks.ibm.com/redbooks/pdfs/sg245977.pdf
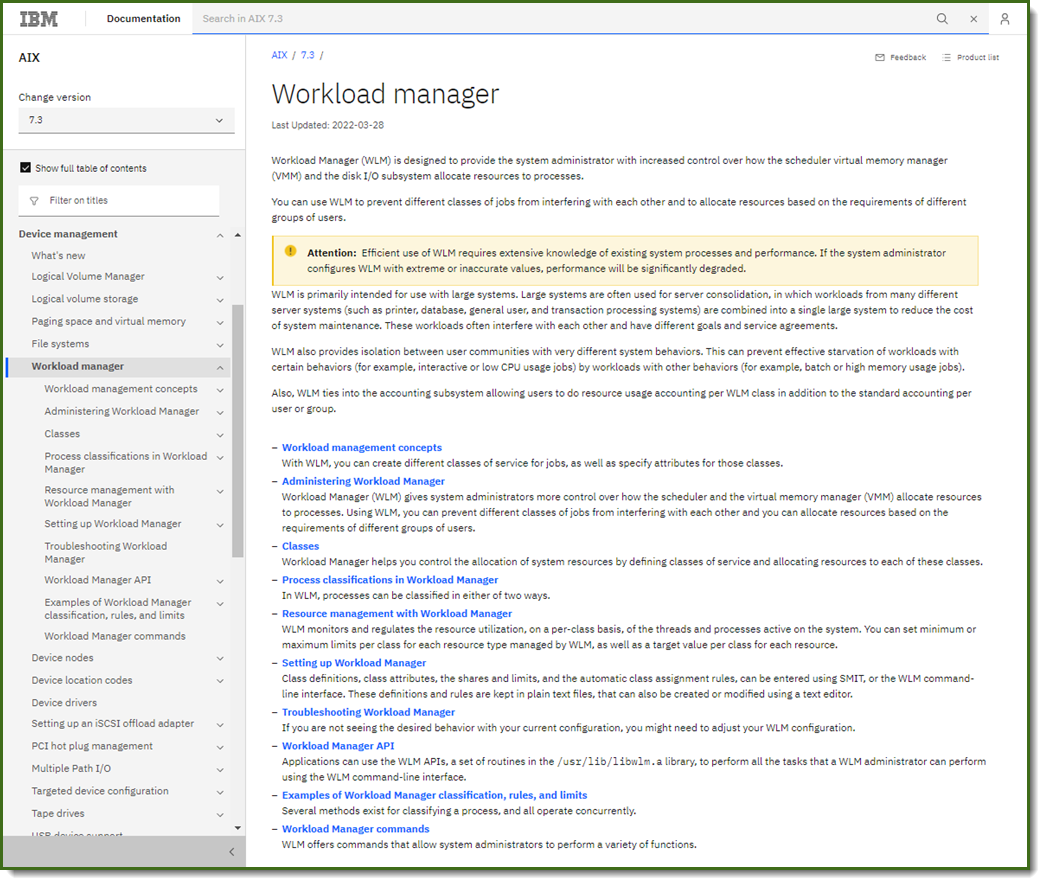
AIX Workload Manager in the AIX manuals
Highlights:
- From the AIX development team
- Lots of chapters and details. See the picture or go to the website
- There appear the are no differences between the manual pages for AIX version 7.1, 7.2, and 7.3.
- Download: https://www.ibm.com/docs/en/aix/7.3?topic=management-workload-manager
- You can also fine the manual pages for the WLM commands: wlmcntrl, wlmassign, wlmcheck, and wlmstat
There is a video on Workload manager by this author:
AIX Workload Manager The Basics
Imaging a time long ago before Power workload partitions (WPAR), virtual machines (VM), and containers (Docker, and so on.). Information technology departments ran much bigger UNIX servers running large numbers of application on a single operating system. Now these workloads are split out across servers.
Large servers or virtual machines still have many workloads, for example, a simple RDBMS might have:
- The database itself,
- Incoming data transfer tools,
- Data transformation tacks,
- Batch processing at night,
- User tasks logging in remotely,
- Backup,
- And many more.
So in old time and now we run many services at the same time on a single operating system instance.
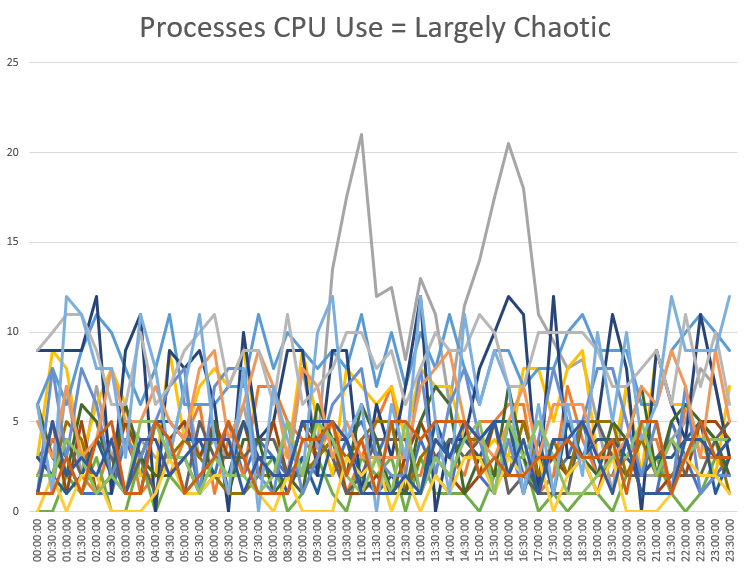
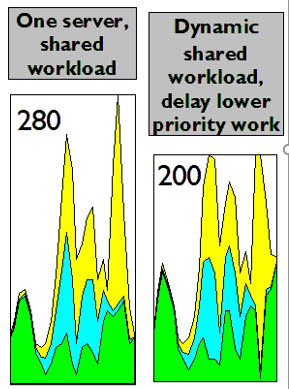
A graph of too many processes is a total complicated mess
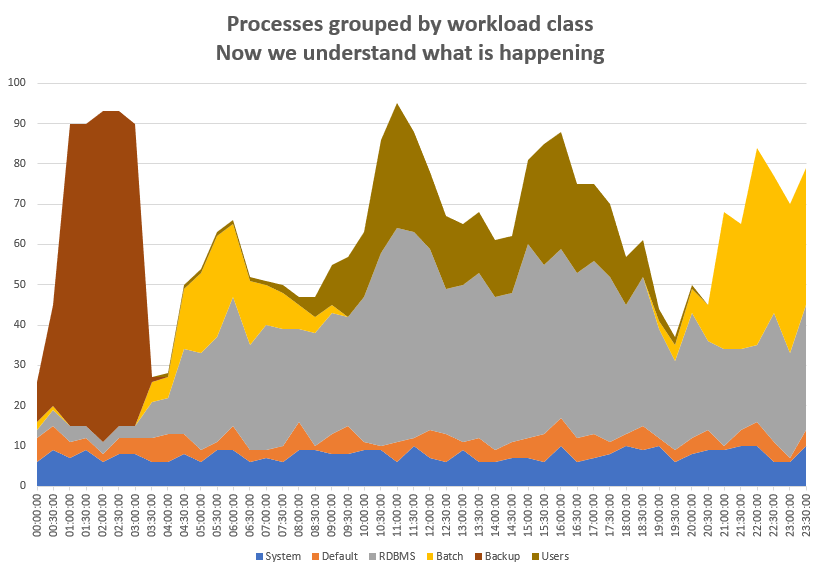
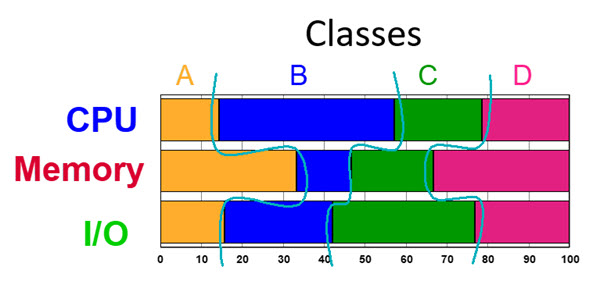
What we need it to group these processes into workloads then the graphs show which workloads are the CPU, memory, and lock I/O hogs over time. Just for illustration purposes grouping processes in to classes simplifies the graph and suddenly workload information and trends emerge:
For illustration purposes, let us focus on CPU time.
Install WLM - it is part of AIX and already installed. Nothing to do here.
Switch in WLM in to active mode. Active means monitor and possibly controlling class resource (if you assign shares):
wlmctrl -a
Alternatively, start in passive mode (monitor only and no possibility of changing the behavior):
Create four new classes for RDBMS, Batch, Backup and remote user connection application:
A simple edit to the test file as the root user: /etc/wlm/current/classes
Name the class and specify how AIX can decide which processes are in which class. A simple way is to name the AIX user that starts the workload programs. Alternatives, are using user groups or the directories that contain the binary program files. Once a process is in a class, the default setting is for all processes it creates are in the same class.
Tell AIX WLM to reevaluate ("u" for update) the classes file:
wlmcntrl -u
Monitor the WLM statistics with classes aware tools to monitor performance
Simple first - wlmstat
$ wlmstat
         CLASS    CPU    MEM   DKIO
  Unclassified   0.00  22.14   0.00
     Unmanaged   0.00  11.49   0.00
       Default   0.00   0.81   0.00
        Shared   0.00   0.79   0.00
        System   0.01   4.57   0.00
         RDBMS   0.00   0.00   0.00
         Batch   0.00   0.00   0.00
        Backup   0.00   0.00   0.00
         Users   0.00   0.00   0.00
         TOTAL   0.01  28.31   0.00
You can get the output regularly in a similar option like vmstat or iostat.
For output every three seconds and outputting hundred times, use:
wlmstat 3 100
While wlmstat is useful for a quick look, it is not good for long-term data collection nor for creating graphs as the output is in an awkward text format.
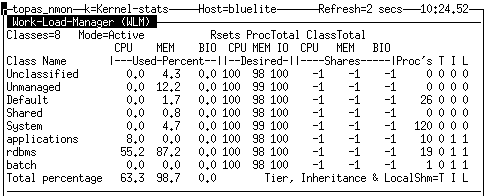
Online WLM with monitor CPU, memory, and I/O with nmon (type "W" to toggle the WLM stats):
Simple post-mortem graphing
The AIX command nmon can save the data in a machine-usable comma-separated values format.
To collect Workload Manager stats to a file, add the -W option. For example,
nmon -f -s 60 -1440 -W
The Excel based nmon Analyser spread sheet can graph the statistics after the data collection finishes.
Advanced-live statistics to be monitored, with instant changes to the graphing period
My replacement tool for nmon is called njmon
From version 80, njmon collects workload Manager statistics and data can be stored in various time series databases. My preferred database in InfluxDB 1.8 due to its ease of getting started, the free open source version makes a great start and along with the Grafana tool for beautiful and flexible graphing system.
First, see how WLM was set up . . .
In this case, I used a further way to get certain processes in to a class. The method uses the wlmassign command to force a running process into the particular class.
I added a class named "
applications" to the
/etc/wlm/current/classes file by added at the end of the file:
applications:
        inheritance = "yes"
        localshm = "yes"
        adminuser = "nag"
Key:
- "application" is the name of the class
- inheritance = "yes"
Means any process that creates a subprocess has the new process added to the same class.
- localshm = "yes"
Means process shared memory is counted as part of the class.
- adminuser ="nag"
Means the user "nag" (that is my username) can add processes to this class. This option stops other users placing their processes in other peoples classes to avoid detection.
For automatically adding processes to a class, the rules are specified in /etc/wlm/current/rules
This rules file is covered later in this article.
I then use a simple ksh script that uses the ps command to find all processes called ncpu (which spins in a loop on the CPUs), extracts the process IDs and then uses wlmassign. if the ncpu processes have IDs 12345 and 67890:
wlmassign applications 12345
wlmassign applications 67890

- or -

wlmassign applications 12345,67890
The wlmassign command can be used as follows to force a batch job in to a class of its own (batch jobs are often started by a shell script):
# Start 3 am batch
/usr/lbin/batchrunner mode6 all phase8
# batch process id = $$
wlmassign batch8 $$
The njmon command then collects the Workload Manager and 100's of other statistics.
Here are the Grafana graphs and settings covering a single user-defined class "applications" and the rest are WLM standard built-in classes:
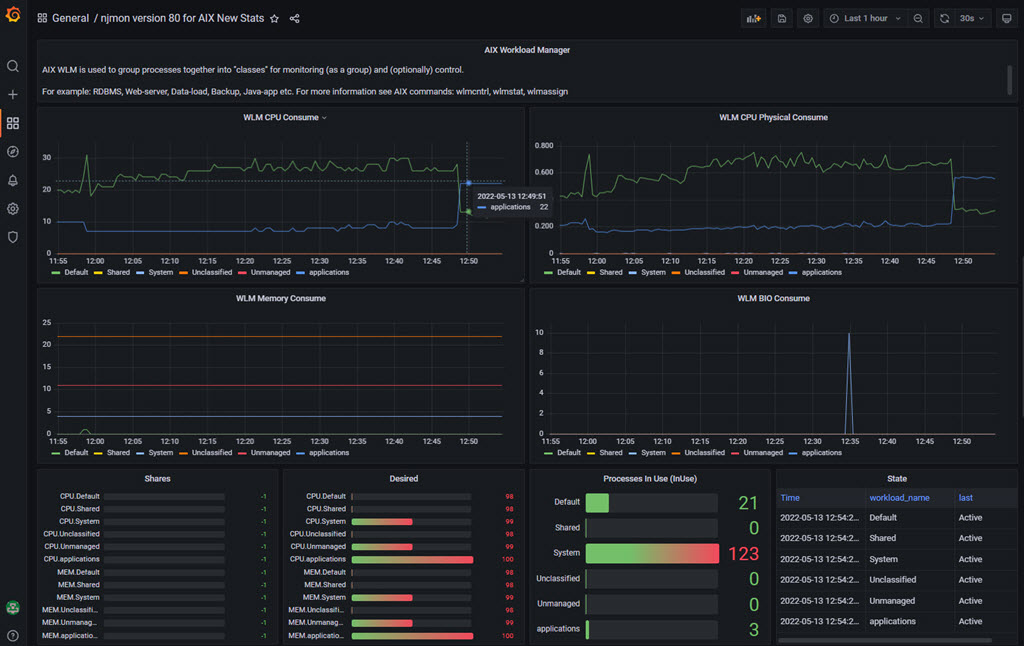
In the graphs there are:
- CPU Consumed
- Showing the CPU utilisation percentages for each class.
- CPU Physical Consumed
- Showing the number of actual CPU cores being used.
- Memory Consumed
- Showing the memory-used percentages.
- Block I/O (BIO)
- It is disk I/O. Shows a percentage of the disk device throughput being used.
- Shares per class
- Used to limit the resources (CPU, memory, and BIO). A value of -1 means the resource control is off.
- Desired per class
- The WLM calculated target for resource control.
- Processes by class
- The number of processes in the class. A useful check that the class definitions are correct.
- State by class
- Shows the status, like Active or not.
Notes on Classes
There are two WLM standard useful special classes:
System classes:
- Operating system kernel internal processes get automatically added to the System class.
- Allows managing system resource usage but it is not recommended to actively manage this class.
- The UNIX CPU utilisation statistics are: User, System, Idle, and Wait for I/O. The System class matches the System Utilisation statistics.
- Note there are a few system classes - see the Redbooks: WLM for the full details.
Default:
- All user processes that not classified get add to Default.
- Allows managing unclassified jobs>
- Use Default for small bits & pieces.
- If this number becomes large, it is recommended that you investigate why? Create a class for these unexpected processes. For example, some shell program pointlessly spinning in a loop.
Shared, Unclassified, and Unmanaged Classes
- Shared covers shared memory pages that are not assigned to other classes.
- Unclassified and Unmanaged - see the AIX Workload Manager Redbook section 2.2 for details.
System administrators can create up to 270 more classes.
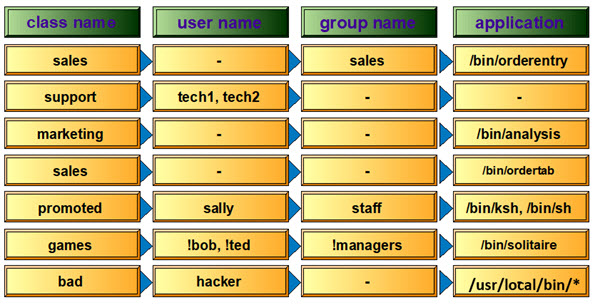
Assigning processes to classes is controlled by the configuration file /etc/wlm/current/classes.
The chart points out the class of a process can be one of many methods:
- The user ID that started the process
- The user group ID of the user that started the process
- The program name in the file system used to start the process
Also, there is
- The class is set to the class of the process, which started a subprocess that uses fork and exec system calls - this setting is called inheritance
- A user forcing a process into a class by that uses the AIX wlmassign command
Legend:
- "*" wildcard can be used for example /usr/local/bin/*
- "-" = all
- "!" = exclusion
After the classes are defined, start WLM or tell it to reapply the settings with: wlmcntrl -a
The following diagram shows for each class the CPU, memory, and disk I/O in monitored. The WLM tool does not consume many CPU cycles. But is useful for understanding the workloads.
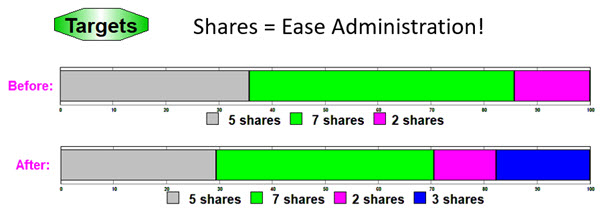
Once the workloads are understood, there is an opportunity to adjust priorities. Perhaps, some classes are vital to the server and get more resources or other classes are less important and yield resources to boost performance to other classes. This control is managed by the assigning of shares to classes for all three resources: CPU, memory, and disk I/O. Most people want to assign percentages but if you make many changes that become tedious, adjusting the number to add up to 100. Shares are a far better method. If all the shares add up to 100, then they are percentages.