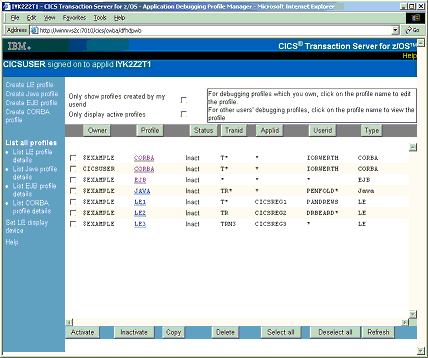
The List profiles page
List profilespage to display a list of debugging profiles:
- When you start the application debugging profile manager's Web
interface, CICS® displays the
List profiles
page.

If there are more profiles than can be displayed in the window, use the scrollbars to scroll backwards and forwards through the list. If you have no profiles, CICS displays an empty list.
List profilespage:
- List LE profiles
- Lists only the profiles for compiled language profiles
- List Java™ profiles
- Lists only the profiles for Java programs
- List EJB profiles
- Lists only the profiles for enterprise beans
- List CORBA profiles
- Lists only the profiles for stateless CORBA objects
List profilespage; however the information displayed on each is specific to the type of profile.
- Owner
- The userid of the profile owner; that is, of the user who created the profile.
- Profile
- The name of the profile
- Status
- The status of the profile (Act for Active, or Inact for Inactive)
The following columns display information specified when the profile is created:
- Tranid
- Displays the contents of the transaction field
- Program
- On the
List profiles
andList LE profiles
pages only , displays the contents of the program field. - Compile Unit
- On the
List profiles
andList LE profiles
pages only, displays the contents of Compile Unit field.If the Compile Unit name is too long to display in the available space, the leading characters are displayed, followed by
. To display the Compile Unit name in full, click the profile name.... - Applid
- Displays the contents of the Applid field
- Userid
- Displays the contents of the Userid field
- Termid
- On the
List profiles
andList LE profiles
pages only, displays the contents of the Terminal field. - Type
- On the
List profiles
page only, displays the type of program specified in the debugging profile:- CORBA
- CORBA object
- EJB
- Enterprise bean
- Java
- Java program
- LE
- Compiled language program
- Netname
- On the
List LE profiles
page only, displays the contents of the Netname field. - Class
- On the
List Java profiles
andList CORBA profiles
pages only, displays the contents of the Class field.If the Class name is too long to display in the available space, the trailing characters are displayed, preceded by
. To display the Class name in full, click the profile name.... - Bean
- On the
List EJB profiles
page only, displays the contents of the Bean field.If the bean name is too long to display in the available space, the leading characters are displayed, followed by
To display the bean name in full, click the profile name..... - Method
- On the
List EJB profiles
andList CORBA profiles
pages only, displays the contents of the Method field.If the Method name is too long to display in the available space, the leading characters are displayed, followed by
. To display the Method name in full, click the profile name....
List profilespage:
- Selecting which profiles are displayed
- Use the checkboxes at the top of the page to select which debugging
profiles are displayed. The options are:
- Display all profiles
- Display all profiles that you created
- Display all active profiles
- Display only active profiles that you created
- Sorting the list
- Use the buttons above each column to re-display the list in the sequence determined by the contents of the column. For example, to re-display the profiles in sequence of program name, click the Program button. CICS uses the EBCDIC sorting sequence when it re-displays the list.