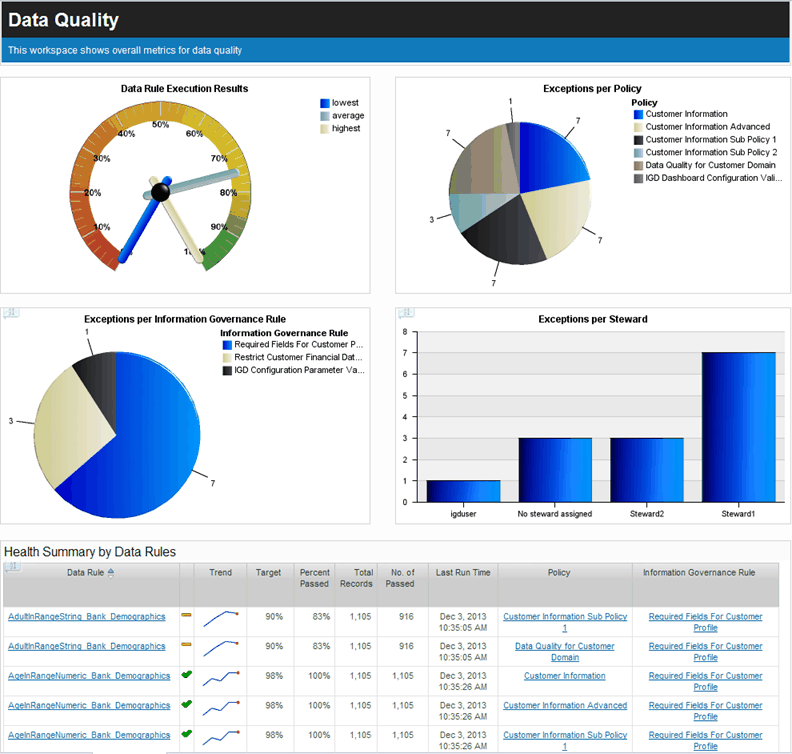
Data Quality tab of Information Governance Dashboard workspace
The data quality charts display success and failure percentages for all runs of data rules. The charts also display the number of data rule exceptions per policy, per information governance rule, and per steward.

- Data Rule Execution Results
- For all data rules, the chart displays the minimum and maximum rate of successful execution, and the average rate of success. Click any hand of the gauge to display the report Data Rule Execution Results vs. Target per Data Rule, which shows results for each data rule. Click a data rule in the report to view details for data rule, including related policies, information governance rules, data rule bindings, and exceptions.
- Exceptions per Policy
- The chart displays the number of exceptions that occurred for runs of all data rules for each information governance policy. Click an area that represents a policy to open the Data Quality Details for Policy report for that policy. The details report displays exceptions for each data rule that implements the policy. The details report also displays the information governance rules that the policy references, the data rules, and the database tables whose columns are bound to the data rules. You can click each asset to display its details report.
- Exceptions per Information Governance Rule
- The chart displays the number of exceptions that occurred for runs of all data rules for each information governance rule. Click an area that represents an information governance rule to open the Data Quality Details for Information Governance Rule report. The details report displays exceptions for each data rule that implements the information governance rule. The details report also displays policies that reference the information governance rules, the data rules, and the database tables whose columns are bound to the data rules. You can click each asset to display its details report.
- Exceptions per Steward
- The chart displays, for each steward, the number of exceptions that occurred during the latest runs of data rules. Click the area that represents a steward to open the Data Quality Details for Steward report. The details report displays the data rules that the steward is assigned to, the related information governance rules, and the database tables whose columns are bound to the data rules. You can click each asset to display a report that is specific to the asset.
- Health Summary by Data Rules
- For each data rule, the heath summary lists the following information:
- The information governance rule that governs it
- The policy that references the information governance rule
- The number and percentage of records that passed and failed
- The target percentage
- An icon that indicates the success rate of the last run of a data rule according to target thresholds that you specify for all data rules or specific data rules.
- The last run time
- The trend of success of failure
Example of drill-through
The following Data Rule Execution Results chart indicates an average pass rate of 75.2 percent for runs of data rules. The lowest pass rate for a run is zero and the highest is 100 percent.

If you click any of the hands, the Data Rule Execution Results vs. Target per Data Rule report is displayed.

Each row of the report shows the performance against target for a particular data rule. The red rectangle indicates the target level that you specified for percentage of runs passed. The blue horizontal bar indicates the actual percentage of runs of the data rule that passed. The target achievement level is calculated by dividing the target percentage into the actual percentage.
If you click the blue horizontal bar, the data quality details report for the data rule is displayed.

For the selected data rule, the details report lists and links to the related policies, information governance rules, and data rule bindings. The Exceptions section shows the results of the latest run of the rule. The red X icon indicates that the percentage of records that passed did not meet the lowest target threshold that you set.
If you click the data rule name at the top of the report, you can view the data rule details in InfoSphere® Business Glossary.


 Last updated: 2016-09-30
 PDF version of this information: