Running lineage reports
You can run lineage reports that combine information from job designs, operational metadata, and user-defined relationships between assets. You can also include dependencies that are not related to data flow, such as job sequencing, for impact analysis. You can see the flow of data through specific child assets, for example, the flow of data through selected database columns of a database table. You can hide assets, or assets and their flows, from the report. You can refine the lineage report by using lineage filters and lineage report templates.
Before you begin
You must have any Information Governance Catalog security role except the Information Governance Catalog Glossary Basic User role.
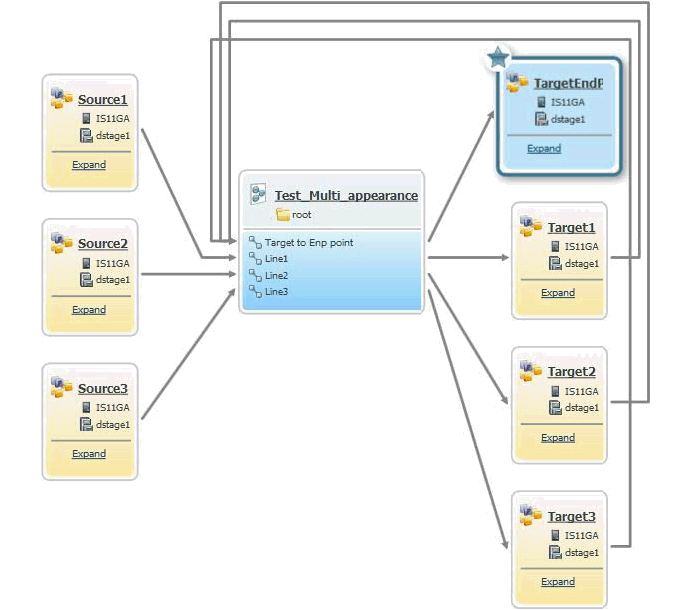
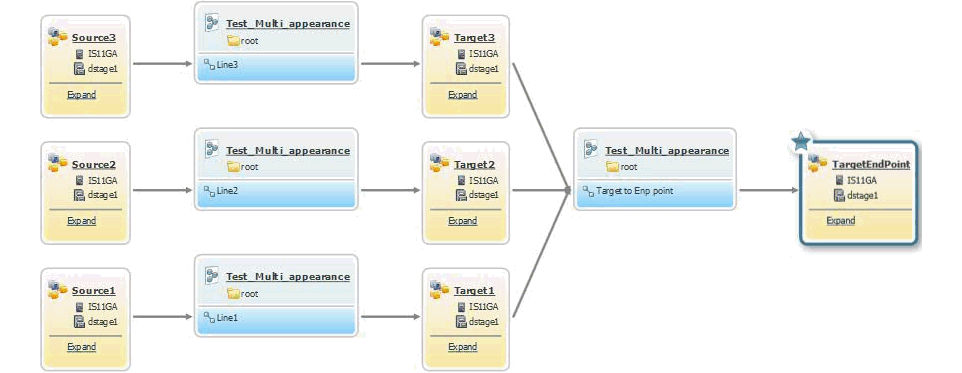
You can display extension mapping documents only once in the lineage report or multiple times. A mapping document can describe the data flow of a single ETL process or script, or it can describe the data flow of multiple ETL processes or scripts. You can choose to repeat the extension mapping documents in lineage reports for each ETL step to improve the report structure. Configure the display setting in .
About this task
Data lineage reports can show the flow of information both to and from a selected asset, or the flow of data in one direction only. By default, the reports include design, operational, and user-defined relationships between assets. Dependencies between assets that are not related to data flow can be added for impact analysis.
In both data lineage and business lineage reports, you can apply a lineage filter to hide assets, or to hide assets and their flows, from the display.
If you applied a lineage report template to design the lineage report, Hover Help in the lineage report also displays the asset properties that you defined in your template.
The default maximum number of nodes that are displayed in a lineage report is 500. If more than
this number of nodes is present in your lineage report, the report is truncated. A
Stop icon  next to a node name indicates that the node is in a truncated branch of the report. A right
arrow indicates that lineage from the node and onward is truncated. A left arrow indicates that
lineage up to the node is truncated. To change the default number of nodes that are displayed, see
this technote.
You cannot run a lineage report from a stage or a stage column that is in a shared container.


 or the
  . Alternatively, in the
  .
.