Sysdig is a powerful open source system monitoring and troubleshooting tool. As the first visibility tool designed specifically to support containers, Sysdig allows you to view things in a way that makes sense as a developer building and running this tool.
Using labels on your Kubernetes objects provides a great way to view your infrastructure in Sysdig. This blog explains how Sysdig really understands Kubernetes to view memory by namespace or to track network traffic. This walkthrough gives real-world examples and insight on how to do this yourself.
Let’s begin by taking a look at my team’s API and seeing how it’s performing without having to worry about machines and networks. We’re running a fairly traditional API over a database to give access to important business entities and using Kubernetes to make it robust and easy to scale.
Great namespace support
Starting at the simplest level, you can see the Kubernetes pods grouped by namespace. That’s really convenient because namespaces provide a great way to organize an application or service in Kubernetes.
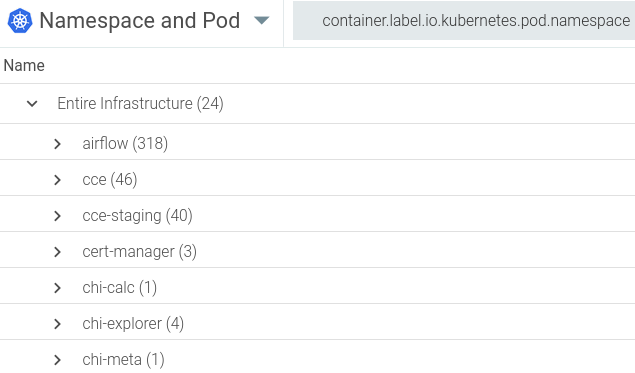 Figure 1: Group by namespace
My team and I practice DevSecOps, meaning the developers on our team act as operators. This makes Sysdig’s strength even more important. It allows you to look at the things you are influencing. For example, you’re going to want to know which things are using available resources and how much. Sysdig makes it easy to see this over time, which is much more powerful than simply showing a snapshot. Here’s a quick overview of which things are using noteworthy amounts of memory.
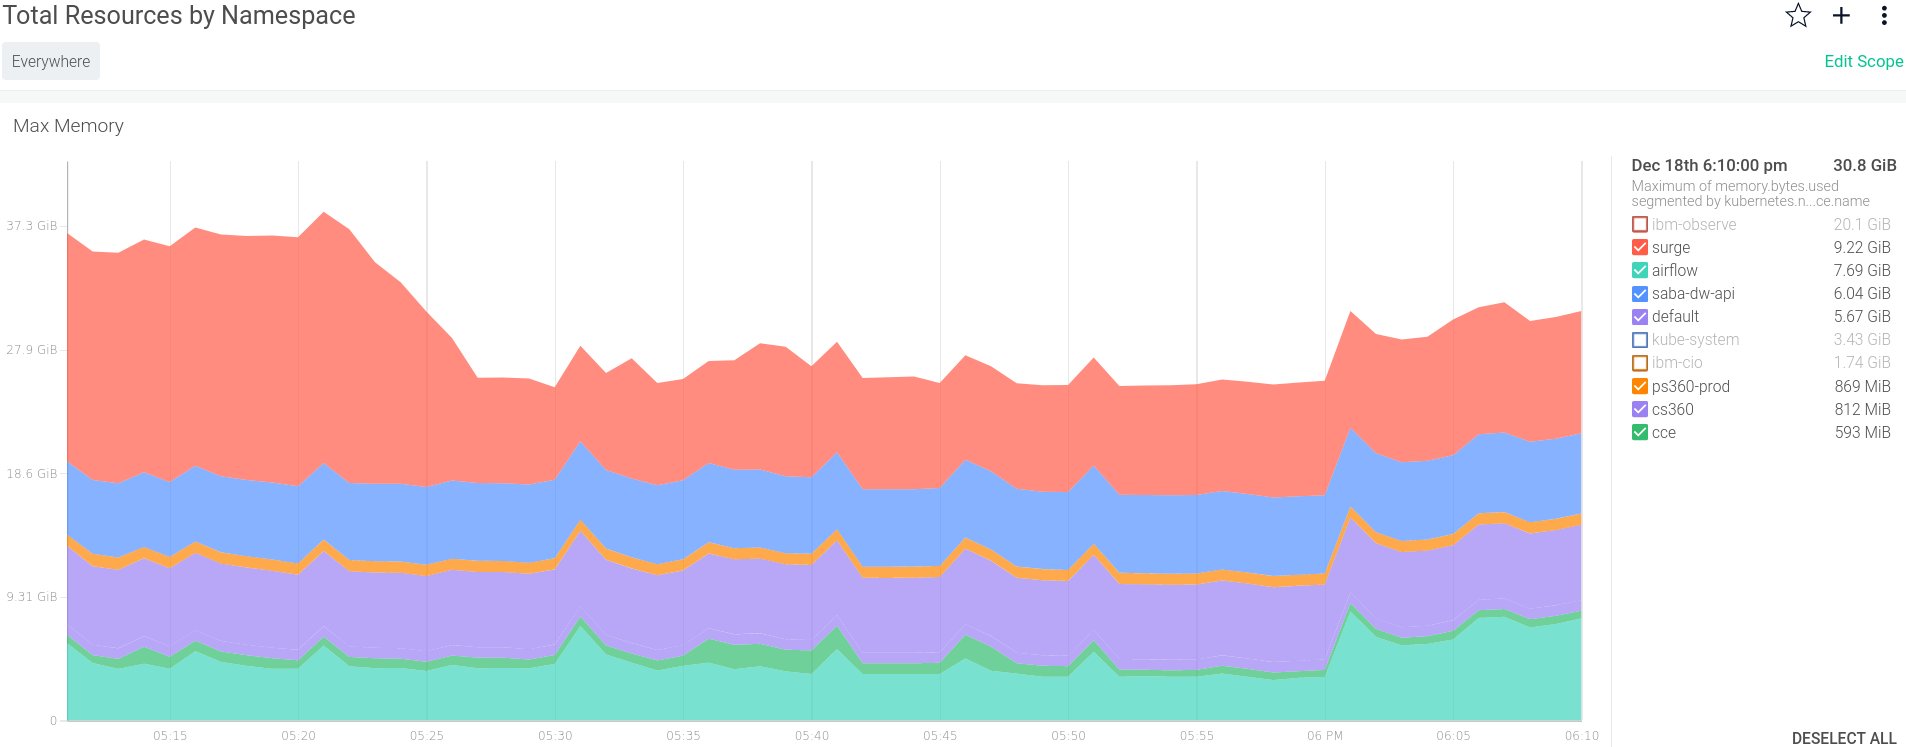 Figure 2: Total resources by namespace
Already, you’re seeing how useful Sysdig is, without even talking about machines, containers, or processes. So far, you have a glimpse at things that the operators are naturally interested in.
In Figure 2, you can also see I chose to clear some items manually to remove them from the chart. I’ll share how to apply filters later.
Great label support
Now you may be wondering, “Did my change break production?” There are several ways I could answer that, but often you want to see how a system changed when you pushed a change to GitHub. Of course, that change flowed straight into production with a zero-touch rolling deployment after it passed its gating tests. Among other things, I’ve labeled the deployments with its Git commit so now Sysdig can shine and show resource utilization by Git commit.
 Figure 3: Resources by Git commit
Clearly, this service has a memory leak, but I can see it wasn’t my recent change that introduced it so I can relax a little (for now).
By now, I’m sure you’re already thinking of other ways to use labels. It’s a fantastic setup and great that Kubernetes supports extensive labeling while Sysdig collects the metadata.
Focus on what matters
You may have noticed in that last screenshot that I filtered what I was showing.

Figure 4: Simple scope
Of course, you can tighten that scope as well as use simple drag-and-select to zoom in on a time window you care about. Ready to take a look at a specific Git commit?
 Figure 5: Memory by pod
What’s interesting here is that it wasn’t just one pod that was affected, but all of them due to the Kubernetes ingress balancing the troublesome traffic.
You probably noticed the peaks and are wondering why things stopped there. Again, Sysdig has captured the data needed to answer that question. Notably, you don’t have to go back and look at what the configuration might have been from your YAML files as you now have the actual value.
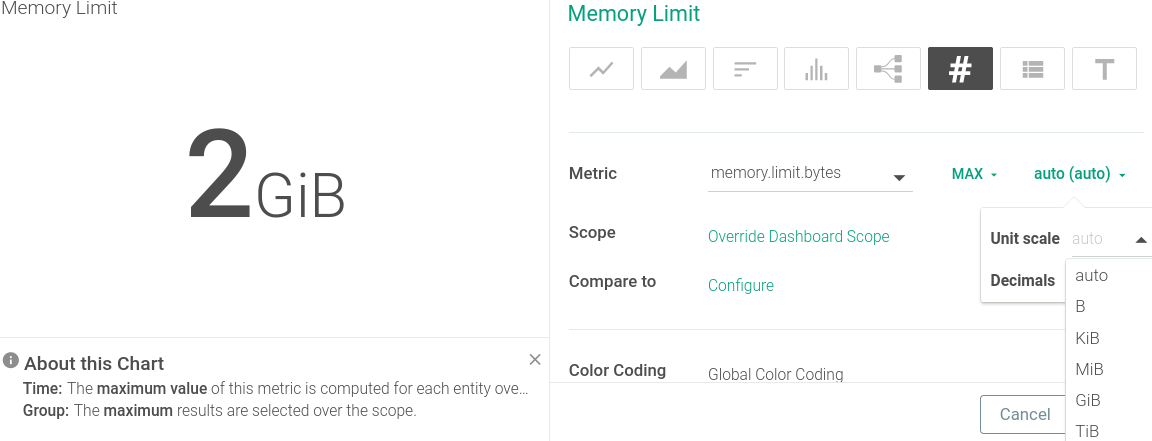 Figure 6: Memory limit
Figure 6 illustrates the configuration page where I chose the “#” symbol to show a single number for simplicity (I could have just as easily chosen a chart to see how it changed over time).
Another feature of Sysdig is its ability to do the right thing by default. I could have set up the scale for this number, but I didn’t need to. The auto option worked beautifully!
So, now it’s clear that something wonderful is happening – Kubernetes is stepping in when the memory reaches the limit and it’s restarting the pod.
But, could this be causing issues for users?

Figure 7: HTTP error count
Figure 7 shows 0.06% of requests that are stumbling. Whilst I’m not happy about that, I know that by adding some new functionality I can help the business far more than worrying about a few failed connections. As a developer, this is exactly the information you need to help guide you and your team.
Peek inside the matrix
Sysdig’s topology view allows you to view traffic within the cluster as well as from outside of it. In Figure 8, I focus on the traffic from a namespace called chi-calc, which consumes the API. Being able to group network traffic by namespace is super useful.
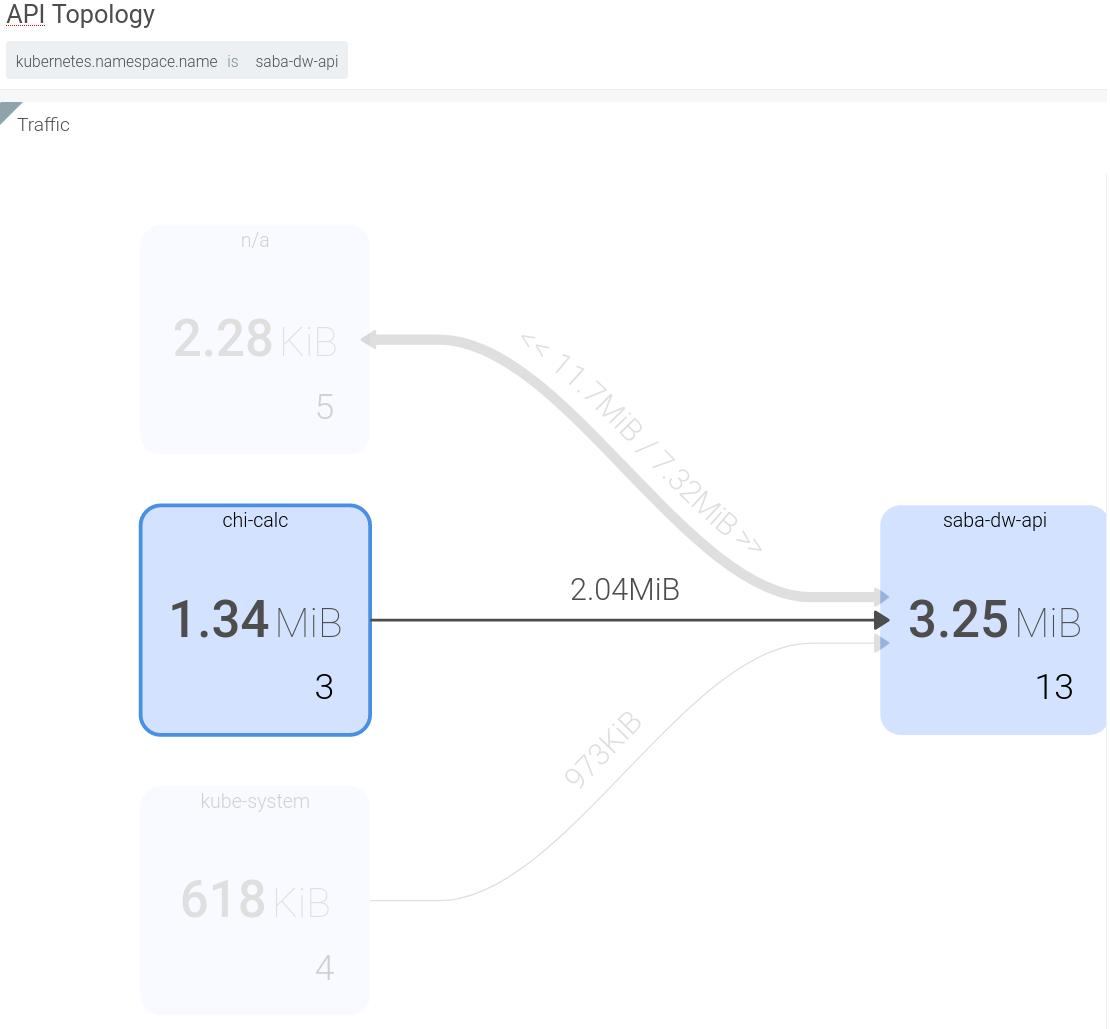 Figure 8: API clients
Excitingly, I can dig into each of those boxes to see what’s in them. In fact, this view covered a time when I ran three instances of the client job. When I expand the box, you can see each of the three client instances. You can expand the API box too and see the traffic between specific instances.
When I’m looking to see what changed, I often build a picture like the one above and then alter the time window. Sysdig has a wonderful way of showing the difference using dashed lines and boxes to show items that went away.
In the image below, I set the time window to be around one of the client job instances. Notice that the older two are marked with dashed boxes because they were previously shown but are no longer relevant.
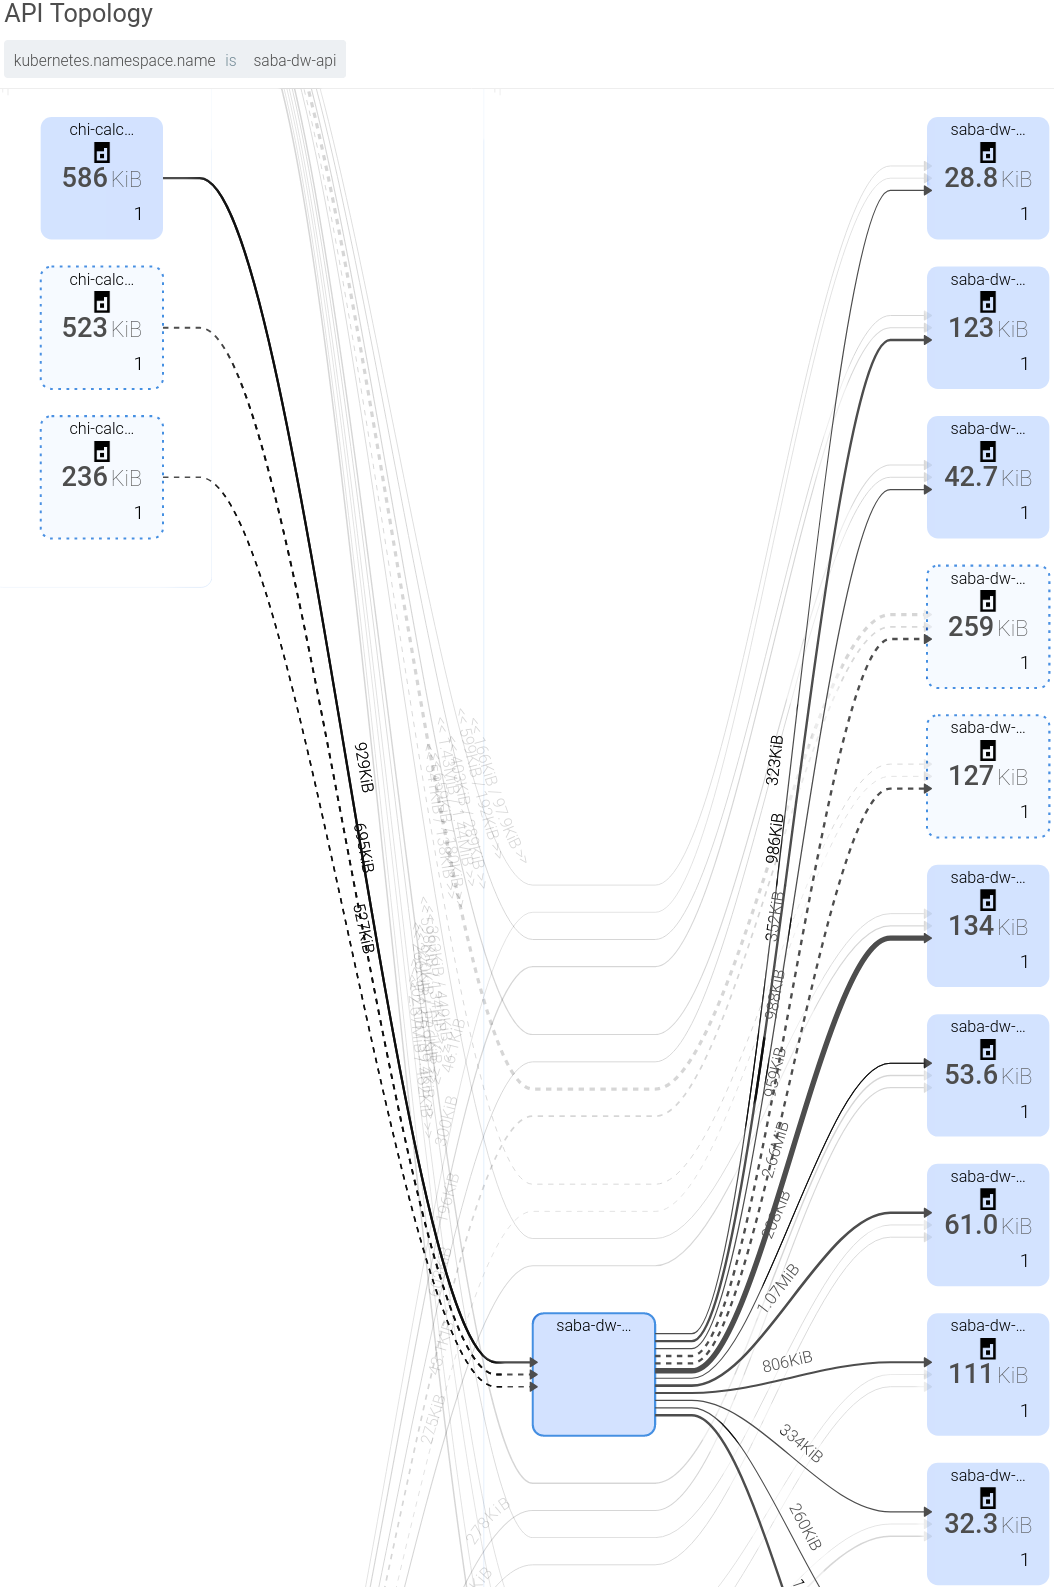 Figure 9: Changes over time
This shows the power of being able to group by arbitrary things. I initially didn’t care about specific instances and just wanted to look at the traffic between namespaces. In a dynamic infrastructure, you don’t want the little details of pods coming and going to distract you from the big picture.
Summary
Thanks for coming along with me as I explored how my API was behaving. Clearly, the Sysdig team’s experience building useful technology is helping me and mine to do the same. Hopefully, you’re now thinking of ways to label your things in Kubernetes to help you easily monitor them.
To learn more about Sysdig and its capabilities, see Set up runtime container security monitoring with Sysdig Falco and Kubernetes. If you want to see how Sysdig works with IBM Cloud, check out IBM Cloud Monitoring with Sysdig.