KPIs
Key Performance Indicators and Key Value Indicators
A simple definition of a Key Performance Indicator (KPI) is that it is a specific way of seeing how well things are (or are not) going with something.
What are the components of a KPI, and what makes a good one? This section will breakdown how to think about and write KPIs to support your Garage projects, and your Garage as a whole.
What is a KPI?
There is a tendency to think of KPIs as complex things, requiring IT integration, data downloads, and calculations to generate a number. While some KPIs can be that complicated, that’s not always the case. A Key Performance Indicator can be very simple or even binary – on/off, yes/no, done/not done.
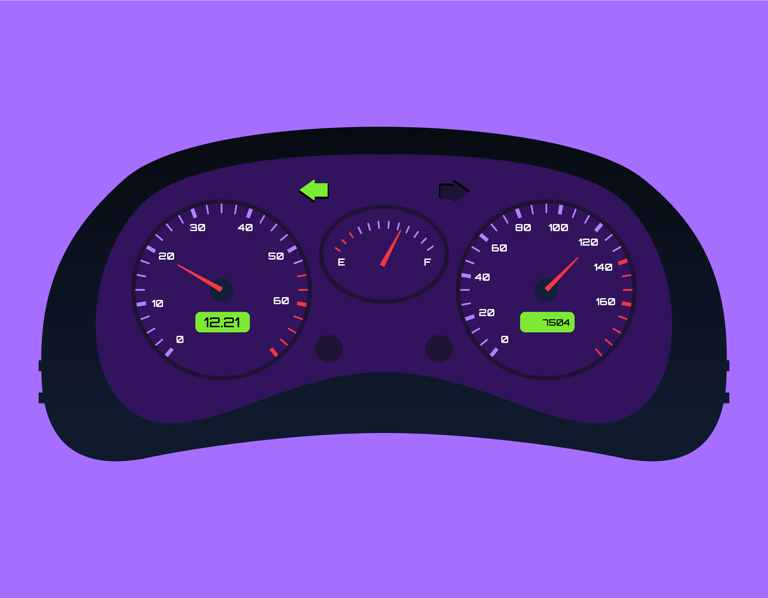
Think of your car dashboard as a set of KPIs for the way your car is running.
You have your speedometer, which is taking driving data and converting into a speed reading that you understand – a complex KPI. It may have a trip computer that tells you how far you can travel on the amount of fuel you have left – another complex KPI based on calculations from different data sources.
Your dashboard also has simpler, but no less useful KPIs. It has indicators that show whether your lights are on or off, and whether your parking brake is on. You have different colored warning lights to say whether your car engine has a problem, and whether it’s minor or major Each of these KPIs is vital for long-term operation of you car- no one KPI is more important than another. For Garage projects, the simpler a KPI you can apply, the better. Just because it’s simple, it doesn’t mean it’s not important.
4-Step Recipe for Writing a Quantitative KPI Measure
Here’s a quick recipe for writing effective quantitative measures for your KPIs.
Often times, IBMers and clients will use quick shorthand to describe a KPI, using two- or three-word phrases like Customer Loyalty, Employee Engagement, Turnaround Time, and Sales Call Efficiency. The trouble with writing a measure or KPI with just a few words is that it leaves too much ambiguity about how exactly it is calculated.
Take Customer Loyalty for example.
There are a number of different ways this measure could be calculated, including:
– Median number of sales per customer
– Total number of years that each customer has been purchasing
– Percentage of the customer base who have given repeat business
– Average rating of likelihood that the customer will continue
purchasing
– Net Promoter Score
We can’t leave measure calculation to chance like this. You don’t have a real measure until you’ve articulated how its values will be calculated. This 4-step recipe for writing quantitative measures for KPIs will help you decide on and measure the most impactful KPIs.

Decide what the best form of summary statistic is to turn raw data into a valuable measure. You have lots of choices, including number (count), total (sum), average, median, percentage, maximum, minimum, range and so on.
Usually the statistic begins the description, as follows
– Order Turnaround Time: Average number of days from order request to order delivery, for completed deliveries, calculated weekly.
The statistic here is the average number of days.
Clearly identify the data item, or data items, to which you are applying the statistic. What exactly are you averaging, or counting, or taking a percentage of?
In taking a percentage, you really have two performance attribute data items.Take the example:
– Commercial Waste to Landfill: Percentage of tons of waste produced that is sent to landfill , for commercial organizations, by month
The two performance attribute data items are:
– tons of waste produced
– tons of waste sent to landfill
Scope data items define the extent of the performance area that the measure should relate to. They define what to include in the measure, or what to exclude.
Here’s an example related to customer referrals:
– New Referred Customers: Total number of new customers referred by an existing customer,by month.
In the measure description the scope data item is ‘referred by an existing customer.’
Contrary to popular practice, the frequency with which you measure something should not depend on reporting time frames. Just because you have a monthly report does not mean your KPI values must all be calculated monthly.
The frequency of your measure should be chosen to detect signals as soon as possible, but not so soon that your signals drown in noise. Measures with too low a frequency tend to give very dull or delayed signals.
Your chosen frequency of calculation for your measure becomes the temporal data item to include in the description, like so:
– New Website Visitors: Number of new website visitors by week.
Well yes, and no. You need to follow this 4-step recipe as the framework of writing a KPI. Your performance measure might still have a more complex calculation that needs more than one statistic, or several performance attribute data items, or a few scope data items.
Here’s a good example of a more complex performance measure:
– International Training Gross Profit Margin: Total sales revenue less total cost of sales, expressed as a percentage of total revenue, for all training workshops that are held internationally, by quarter.
When we write our KPIs and performance measures quantitatively with this 4-step recipe, it’s easier to work out what data is needed and how to turn it into the values that tell you something meaningful. This means we’ll have a much higher chance of success in bringing each KPI to life, and of demonstrating valuable changes in outcomes as a result of our Garage’s efforts.

Common value equations / scenarios
Every IBM Garage engagement is an opportunity to deliver something totally new to the world.
Every IBM Garage engagement is an opportunity to deliver something totally new to the world. There are nuances to each Garage (industry, client goal, scale, technology, and more) that add complexity and subtleties to the way IBM can help bring value to the client. Given those complexities and nuance, care should be taken to properly identify the right measurements and calculations to accurately estimate the projected and delivered value.
Garages with the capacity often bring in a team member whose primary responsibility is value orchestration to ensure they are bringing the right calculations to the table. Other Garages who may be working a bit leaner have to be more scrappy in defining and measuring value.
There are a couple of resources that can help any Garage practitioner address their specific needs:
KPI Database (or better Benchmark Wizard) has business process KPIs and practices with the ability to filter results using peer groups such as industry or region.
CBM.ai is a framework for modelling and analyzing a business for the purpose of organizing and grouping business activities into basic building blocks of a business called business components.
IBM Garage Experience is the Garage governance and executing tool of choice. It will allow garage practitioners at all levels to track Pain Point and Value Drivers, orchestrate Business Opportunities, identify Outcomes, manage Impediments, manage Iterations and monitor Squad Health as well as Productivity and Efficiency.