System Testing for C
During the execution of the test, System Testing generates trace data this is used by the UML/SD Viewer. The System Testing sequence diagram uses standard UML notation to represent both System Testing results.
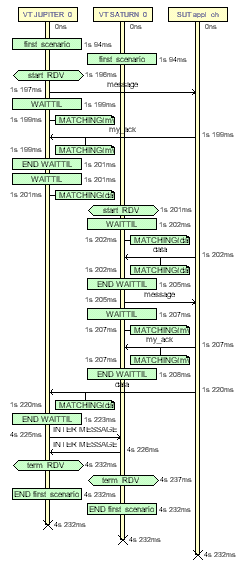
This is an example of a typical System Testing UML sequence diagram.

You can modify the appearance of UML sequence diagrams by changing the UML/SD Viewer Preferences.
When using System Testing with Runtime Tracing or other Test RealTime features that generate UML sequence diagrams, all results are merged in the same sequence diagram.
You can click any element of the UML sequence diagram to open the System Testing reports at the corresponding line. Click again in the test report, and you will locate the line in the .pts test script.
Virtual Testers and System Under Test
The system under test (SUT) and the Virtual Testers (VT) are represented as vertical instances. Messages sent and received by the Virtual Tester are represented along the Virtual Tester lifeline.
Messages are sent and received between Virtual Tester and system instances.
RENDEZVOUS statements are displayed as Synchronizations in the Virtual Tester lifeline.
Test script events and errors are represented as UML actions. Only significant instructions, such as INITIALIZATION, WAITTIL blocks and test errors are represented.
By default, errors appear in red. Other events are green.
WAITTIL blocks are displayed with their start and end events. Matching conditions are represented as notes. Use the mouse cursor tool-tip to get more information about the matching conditions.
If you are using the On-the-Fly option, only the following information can be displayed in real-time during the execution of the application:
Virtual Tester and system under test
Messages
Rendezvous
Test script blocks
Related Topics
About the UML/SD Viewer | UML/SD Viewer Toolbar | Understanding System Testing Reports | On-the-Fly Tracing