Pivoted OLAP Cubes Table

- Across geographic regions, churners have much less tenure as customers--about half as much as non-churners.
- Customers who churned last month have lower average incomes yet spend about as much on monthly services as customers who did not churn last month. Hence, churners are spending proportionately more of their income on these services than are non-churners.
Because the distributions of these variables tend to be skewed, you should also examine the median statistics for these groups.
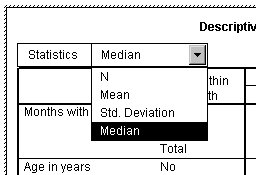
- Activate the table again by double-clicking on it.
- Select Median from the list.


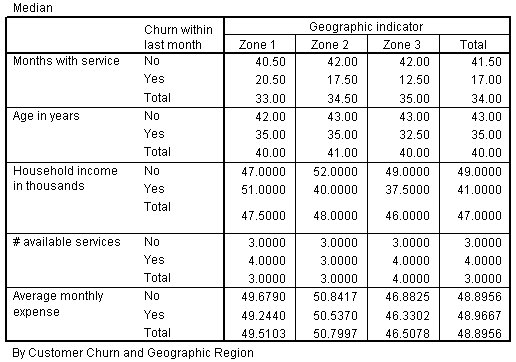
- As expected, median incomes are dramatically lower than average incomes across all groups.
- Further, customers who churned and live in zone 1 have a higher median income than customers who did not churn. This was not true for the average income table.
- Finally, there appears to be an interaction between churn and zone with regard to months with service. Across all regions, the median for non-churners is about 41 months. For churners, region is a factor to consider. Note their gradual decrease from zone 1 to zone 3.