Stepwise Coefficients

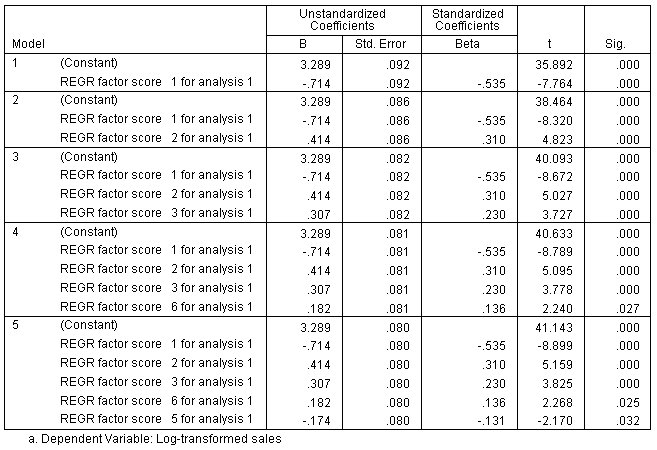
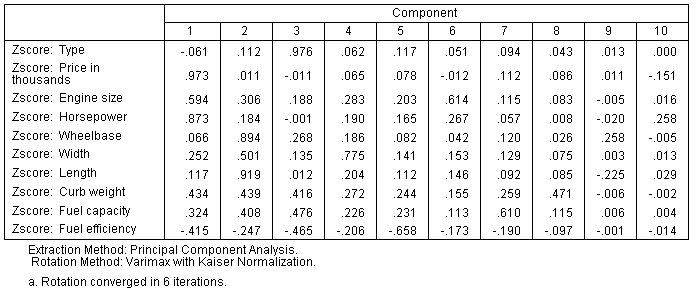
The stepwise algorithm chooses factor scores 1, 2, 3, 5, and 6 as predictors; in order to interpret these results, you'll need to look at the rotated component matrix in the Factor Analysis output.

- The first component (factor scores) loads most strongly on price and horsepower. Since the regression coefficient is negative for factor score 1, you can conclude that more expensive, higher horsepower cars can be expected to have lower sales.
- The second component loads most strongly on wheelbase and length. Since the regression coefficient is positive for factor score 2, this suggests that larger vehicles are expected to have higher sales.
- The third component loads most strongly on vehicle type. The positive coefficient for factor score 3 suggests that trucks are expected to have higher sales.
- The sixth component loads most strongly on engine size; note that engine size loads almost as strongly on the first component, so the positive coefficient for factor score 6 suggests that this partially offsets the negative association between engine size and sales that is suggested by the negative coefficient for factor score 1.
- The fifth component loads most strongly on fuel efficient; the negative component loading combined with the negative coefficient for factor score 5 suggests that more fuel efficient cars are expected to have higher sales, all other things being equal.