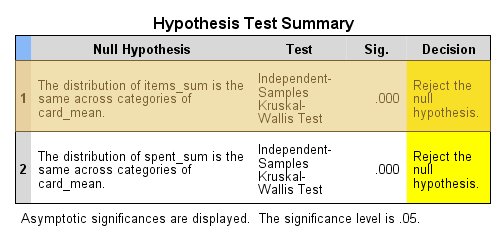
Hypothesis Test Summary

By default, the procedure creates a model object in the output Viewer. Alternatively, you can generate pivot tables and charts by selecting Pivot tables and charts in the Output Display group on the Output tab of the Options dialog (Edit > Options). This example uses the model object. By activating (double-clicking) this object, you gain an interactive view of the model.
The default main view is the Hypothesis Test Summary view. The summary table indicates that both the number of items purchased and the total amount spent differs across primary card types.