Word cloud
Use a word cloud visualization when you want to see a text-based visualization of a column. The text height represents the scale. The name itself is the different members of the column.
Tip: The data asset should contain at least 15 columns and at least 100 rows to create
an effective word cloud.
For example, this word cloud visualization shows the customer life time value by vehicle size and class.
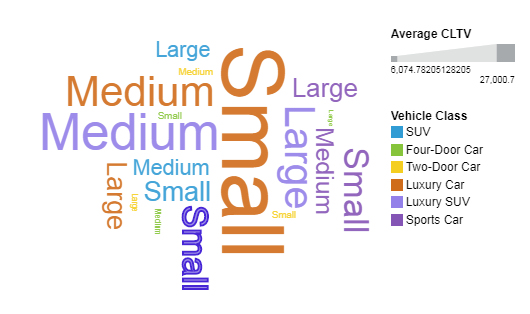
The word cloud was created by dragging the following data items from the Sources panel:
- Drag Vehicle size type onto the Words field.
- Drag Average CLTV onto the Size field.
- Drag Vehicle class onto the Color field

Samples
You can see an example of a word cloud visualization in the sample report Customer lifetime value analysis. You can find the sample here: Team content > Samples > Reports > Customer lifetime value analysis.
If any of the sample objects are missing, contact your administrator.