Web console
The functionality, look, and behavior of the web console differ from the Sterling Control Center console. Because the web console provides a subset of Sterling Control Center functionality, the interface has a more simplified look, with fewer items on the main screen.
- What you see on the web console when you first log in depends on the permissions set for your user ID. This discussion assumes the user has full access and permissions to all functionality, servers, and groups.
- If a user attempts to log in multiple times, a warning message displays, which identifies the user ID and number of other logins by that user.
- Your web console session will time out due to inactivity unless the Auto Refresh option is enabled.
- Dashboard to access the widgets: Recent File Transfer Activity widget, Active Alerts widget, Transfer Scorecard widget, and Environmental Health widget, to see an aggregated, snapshot view of server and file transfer status.
- Server, which lists all individual servers. You can right-click a particular server to open a context menu for selecting the additional information you want to see, such as Handled Alerts, Queued Process Activity, or Select Statistics for an individual server.
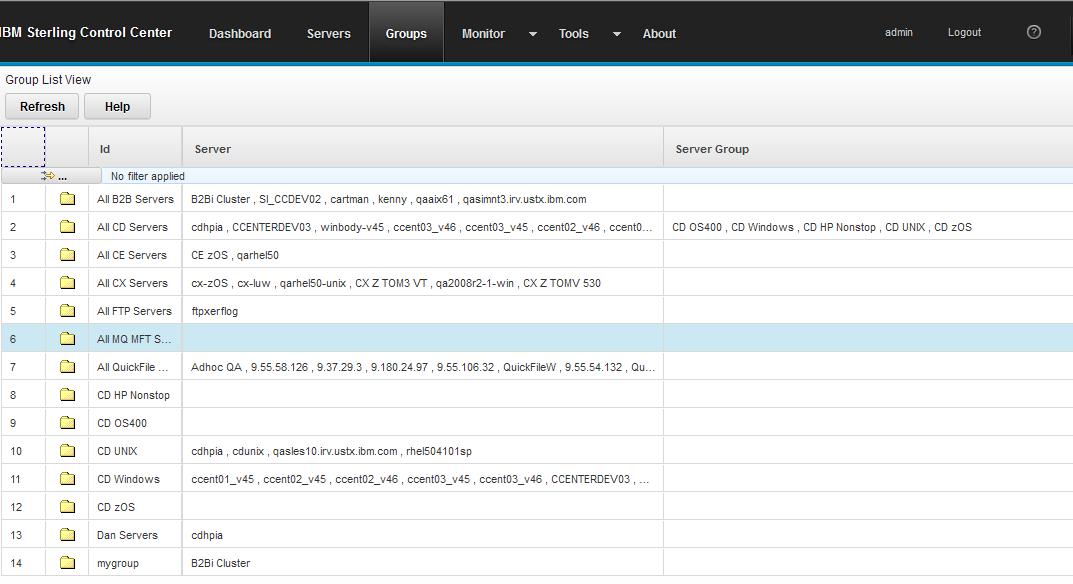
- Groups, which lists both the groups you defined and the system server groups provided in Sterling Control Center.
- Monitor, for choosing one of the following
options:
- Active Alerts
- Handled Alerts
- Completed Processes
- Queued Processes
- Completed Files
- Tools, for running reports.
- About, which shows copyright and version information for the general, engine, and browser components.
Users who have roles that are data visibility restricted see only the data associated with their data visibility group, whereas unrestricted users see all data.
Server List View
The Server List View shows the servers defined in Sterling Control Center by server type in alphabetical order. This view shows general information for all servers, such as Name and Server Address.
To see additional properties unique to a server, right-click a server, select Server Properties from the menu. Then from the Server Properties pop-up window, select the type of property information you want to see, such as Environment for Sterling B2B Integrator servers.
- Active Alerts
- Handled Alerts
- Daemon Status Monitor
- Properties
- Pause Monitoring
Group List View

- Sterling Connect:Direct®
- IBM Sterling B2B Integrator
- IBM Sterling Connect:Express
- IBM Sterling Connect:Enterprise for z/OS
- FTP
- IBM MQ Managed File Transfer
- IBM QuickFile
- IBM Sterling Connect:Direct for HP NonStop
- IBM Sterling Connect:Direct for i5/OS™ (OS400)
- IBM Sterling Connect:Direct for UNIX
- IBM Sterling Connect:Direct for Microsoft Windows
- IBM Sterling Connect:Direct for z/OS
Filtering information and manipulating columns
- To change the width of a column, drag the boundary on the side of the column heading until the column is the width that you want.
- To change the column order, point to the border of the column. When the pointer becomes a move pointer, drag the column to the other location.
- To filter information in a particular column, left-click on the filter bar immediately below the Column heading to open the Filter pop-window. The column you left-click under is preset in the Column field but you can change it to any column in the grid, type the string in the Value field, and click Filter. For example, to see all processes with IDs greater than 77000, select Process Id for Column and is greater than for Condition. Then, type 77000 for Value and click Filter. (To preset the column to Process Id, you could left-click under the Process Id column heading to open the Filter window and have that field pre-selected.)
- Use one of the following methods to filter and clear filter information:
- To filter information for a single filter rule, click the filter bar immediately below the column heading you want to use to filter data. Select the Condition from the pull-down list, type the string in the Value field, and click Filter. (The number of items matching the criteria is displayed along with the total number of items on the filter bar.) For example, to see all messages that contain the text, Connect:Direct, click the filter bar below the Message Text column, select contains for Condition. Then, type Connect:Direct for Value and click Filter.
- To filter information for multiple filter rules, click the Define filter button, select your criteria from the Column and Condition pull-down lists, type the string in the Value field, and click the Add Button. Define the next rule and click Filter.
- To clear a filter, open the Filter dialog box by using one of the preceding methods and click Clear or click Clear Filter on the filter bar.