Web Reports
The Web Reports program can monitor, print, or archive the status of the local database. It allows you to get an overview of your relevant Fixlet messages and any subsequent remediation efforts. You can create charts summarizing the number of administered computers in your network and your overall vulnerability status. In addition, you find comprehensive statistics and a list of the most common issues detected. You can drill down into these commonly relevant Fixlet messages at any time to see them in greater detail.
Web Reports also has the ability to read the databases of other IBM Endpoint Manager Servers and aggregate the data. This offers you a top-level view of a large or far-flung enterprise with multiple database servers. Aggregation servers allow you to view information from multiple networks with hundreds of thousands of computers.
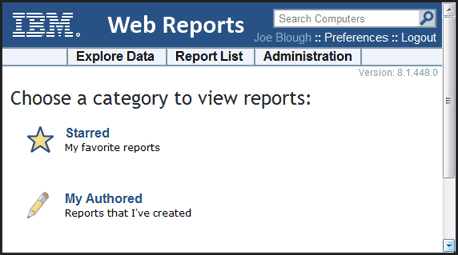
You can view the data in the database from several different points of view and save or print the output. You might also export the output to Excel for further manipulation. These features are provided by the IBM Endpoint Manager Web Reports program, which can be run at any time from the desktop by selecting Tools > Launch Web Reports. You must supply your credentials to log in. When you do, you are shown the introductory panel:

There are three main links at the top of the panel.
- Explore Data: Click this link to look at a group of predefined reports and charts that you can easily filter and customize. This section provides you with an instant overview of the most basic data managed by IBM Endpoint Manager, including Computers, Actions, Operators, and more.
- Report List: Click this link to get a look at basic reports organized around your Fixlet content. Create and customize reports with a simple, intuitive interface. Some commonly-requested reports are built-in, such as Operating System Distribution and Vulnerability Trends. Select them for display by clicking their titles in the list. You can create your own custom reports and save them as either public or private (viewable only by you). Your public reports are added to the reports list; your private reports are only available when you log in with a correct password.
- Administration: Click this link to gain access to various administrative functions, including scheduling activities, managing filters, operators, database settings, and users.
In addition, there are two report categories to get you started.
- Starred: This link takes you directly to favorite reports that you have flagged as starred.
- My Authored: This link takes you to a list of those reports you personally created.
Depending on your configuration, there might be more categories available from this startup panel.
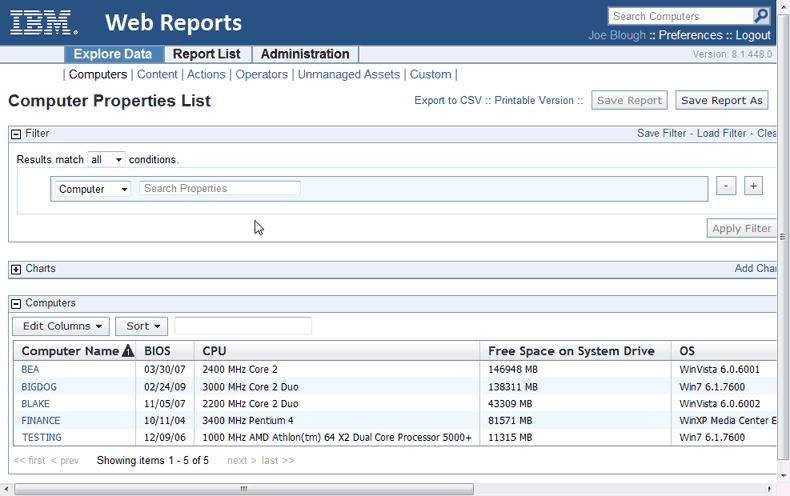
Here is a snippet of a typical report, summarizing the computers in your network by their properties. To produce this report, simply click Report List then select Computer Properties List.

Web Reports can be viewed at any time from the Console under Tools > Launch Web Reports.
Any Web Report server can be set up to aggregate data from the other IBM Endpoint Manager Servers. Talk to your Site Administrator about setting up an aggregation server. Refer them to the Administrator's Guide for further information.
The Web Reports interface is very rich and its complete documentation is beyond the scope of this guide. For more in-depth information, see the Web Reports Guide.