Viewing license usage on the Licensing dashboard
License Service Reporter shows the highest license usage in the environment on the Licensing dashboard.
You can access the Licensing dashboard from the Administration panel.
- Log in to Administration panel as a Cluster Administrator or a Cloud Pak Administrator and select Licensing from the main navigation menu.
- Log in to Administration panel as a Cluster Administrator or a Cloud Pak Administrator. After you log in, access the main navigation menu and click Home to access this dashboard. On the Licensing cluster details summary card, click View license usage report.
- Log in to the OpenShift console of the cluster where you deployed License Service Reporter. Go to Networking > Routes. Find the cp-console route and click the link under Location.
Add the following part after the route:
/license-service-reporter. For example:https://cp-console.example/license-service-reporter.
Note:
- After you deploy and configure License Service Reports, it takes around 30 minutes for the dashboard to load the licensing data. During this period, you see the No data message on your dashboard.
- The transfer of licensing data is not immediate, and the new data might show on the dashboard with the delay of up to 24 hours.
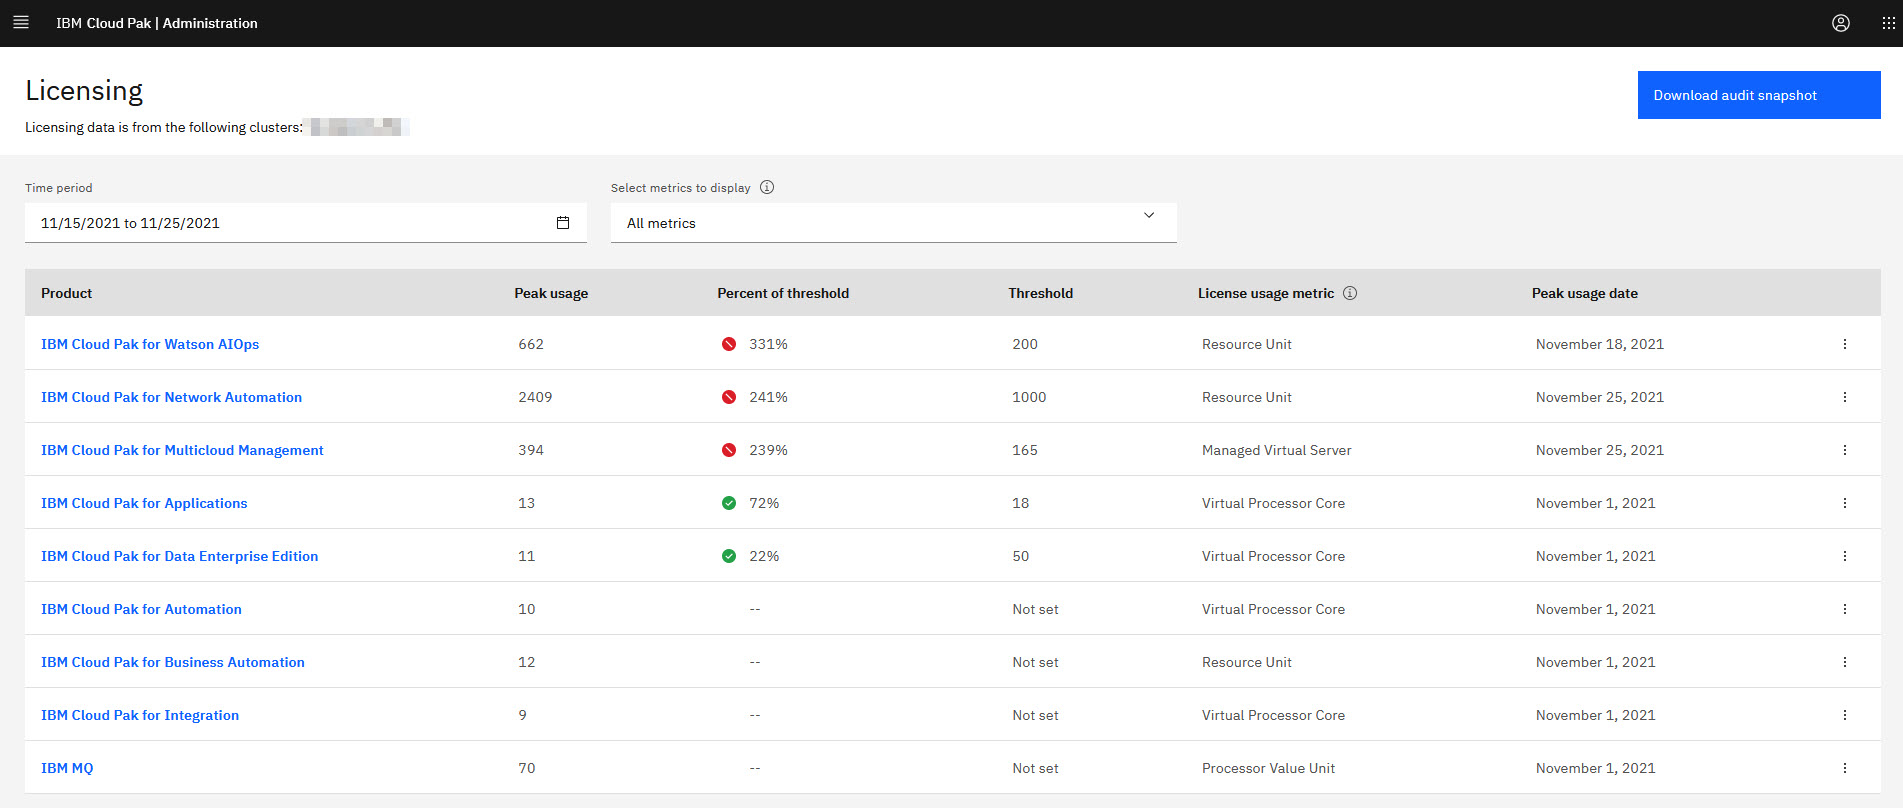
License Service Reporter shows the highest license usage of the IBM Cloud Paks and IBM stand-alone containerized software over a specified reporting period. The names of the clusters that the licensing data is based on are listed on the dashboard.
Top-level view
The top-level view shows the number of license metrics that is used by IBM containerized software that is detected in your environment within the reporting period. The value is based on the analysis of the license peaks from each cluster and it is the highest license usage that is registered in the environment.
Filtering options
-
Time range - By default, the dashboard shows the current reporting period which is the current month. To change the time range, click the Calendar icon under Time range and select the period for which you want to view the highest license usage for your products. You can select a specific month, quarter, or year or set a custom period.
-
Select metrics to display - By default, the dashboard shows information about all metrics. You can filter the view to see only the metric or metrics that you are interested in. To filter by metrics, click All metrics to expand the list and check the boxes next to the metrics that you want to display. The number of the metrics that are applied on the report is displayed in a grey box.
Columns
- Product - The name of the product that is deployed on the cluster.
- Peak usage - The highest license usage within the selected reporting period. License peak is calculated by adding the daily license usage of the product from all clusters. Then, the daily sums are compared. The highest sum is the value that is displayed as the peak usage. The status icon next to the peak usage value indicates whether the value is within the set threshold.
- Percent of threshold - The percent represents how the actual peak usage compares to the threshold that is set for the product.
- Threshold - The number of metric units that is specified for a product and can be compared with the peak usage.
- License usage metric - The name of the metric based on which the product is licensed.
- Peak usage date - The date when the license peak was recorded.
Sorting
You can sort the information on the dashboard by any column by clicking on the header.
By default, the products are sorted by the threshold status.
Setting the license usage threshold
You can set a license usage threshold for each product to see how it compares with your actual license usage. Threshold is a means of control that helps you better understand your actual license needs.
The threshold is the license usage limit that is expressed in a number of metric units. The threshold can, for example, base on the number of license metrics that you purchased, or be any other value that facilitates control in your environment. Setting the threshold is optional and its value can be modified at any time.
To set, reset or clear the threshold for a product, complete the following steps:
- Click the overflow action menu next to the product and select Threshold settings.
- Set the threshold.
- To set or reset the threshold, specify the number of metric units.
- To clear your current threshold, select Do not set.
- Click Save.
After you set the threshold, the percent of threshold is automatically populated and the status icons that can help you control the limits appears before the percent. The icons indicate whether your current license usage is within the set threshold, according to the data collected from the clusters:
- The green tick indicates that the license usage for the product is below the set threshold.
- The yellow icon indicates that the license usage for the product is close or equal to the threshold.
- The red warning indicates that you exceed the set threshold. Consider what that can mean for your business.
The threshold can also be viewed and modified on the deep dive.
Generating audit snapshot
To generate an audit snapshot that is based on the selected criteria, click the Download audit snapshot button, and confirm by selecting Download.
When you download audit snapshot, you get a .zip package with a collection of audit snapshots for each cluster. Each audit snapshot is a compressed .zip package that includes a complete set of audit documents that certify
your license usage per cluster. For more information about audit snapshot and its contents, see Audit snapshot.
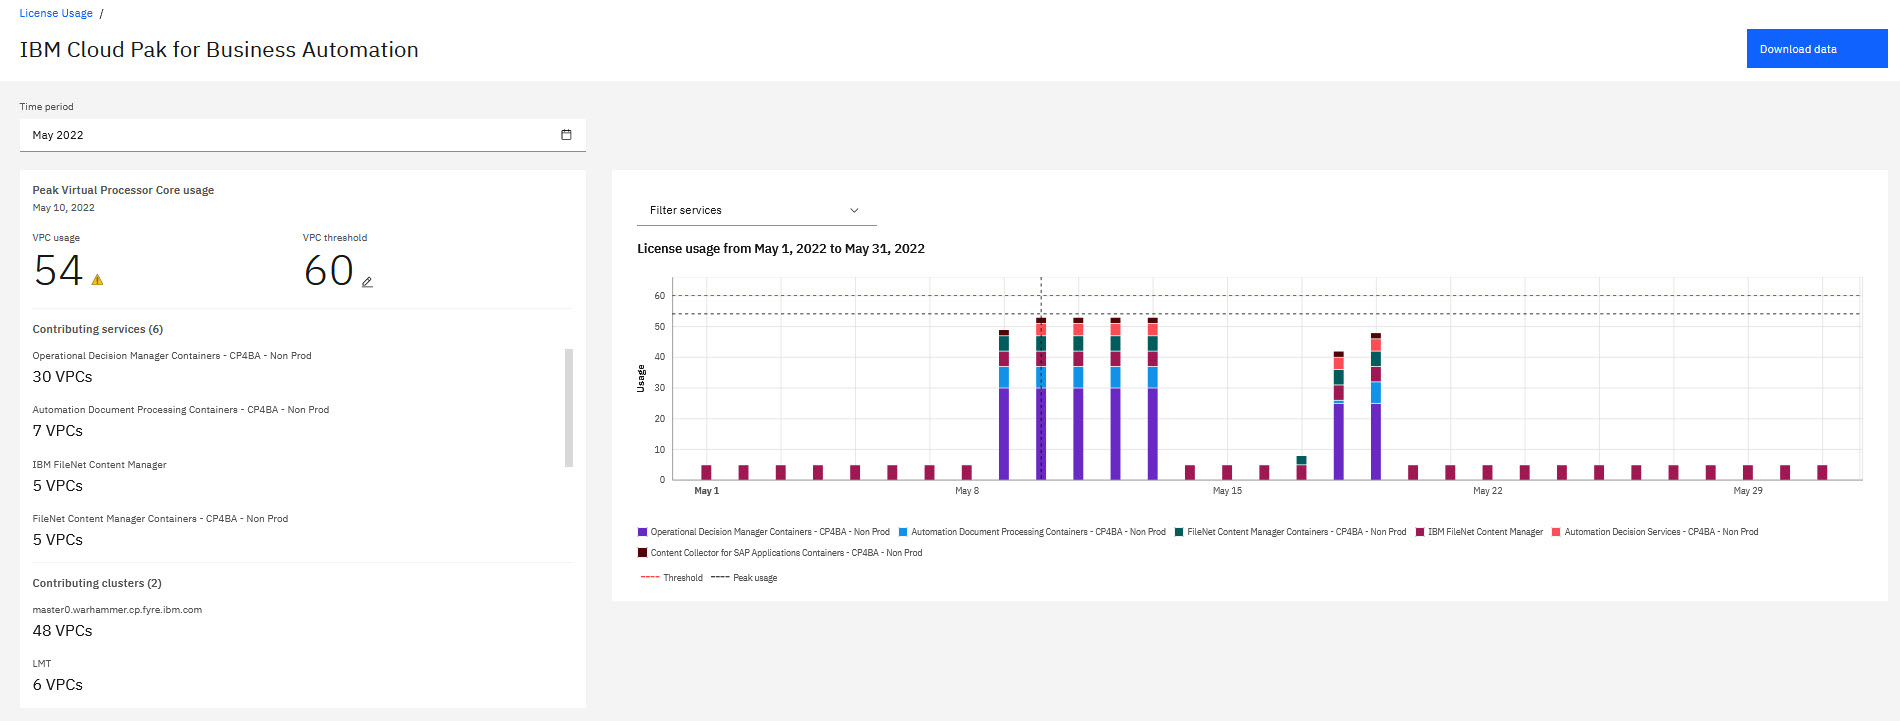
Deep dive
The top-level view shows the highest license usage of IBM containerized software. To view the detailed information about the license usage of a specified product, click the name of the product and see the deep dive.
Time range
By default, the time range on the deep dive is inherited from the top-level view. You can customize the time range by clicking the Calendar icon.
License usage details
The deep dive shows the following information:
- Peak license usage - The date when the highest license usage for the product was registered within the set time range.
- Contributing services - The breakdown of the peak usage by bundled products that contribute to the overall license usage of the IBM Cloud Pak® within the set time range. When the bundled product is licensed with a different metric than the IBM Cloud Pak®, the original recorded metric of this bundled product is also displayed. Available for IBM Cloud Paks only.
- Contributing clusters The breakdown of the license usage peak by individual clusters within the set time range. Available for all products.
- License usage chart - The chart that presents the license usage of the product over time. For IBM Cloud Paks it additionally shows how the individual bundled products contributed to the highest license usage.
Click Download data to export the detailed information about the highest license usage for the product in the form of the .csv file. The file contains information about the contribution of the bundled products in the overall product license usage. In case of IBM stand-alone containerized products, the file contains only the information about the highest license usage of this product.
No data on the dashboard
After you deploy and configure License Service Reports, it takes around 30 minutes for the dashboard to load the licensing data. During this period, you see the No data message on your dashboard.
However, it might happen that the dashboard does not display any data after these 30 minutes, or at one point after you start using the dashboard. The following message is displayed instead:
No data. It looks like there is no data to display for selected period and metrics. For more information, see documentation.
The message can indicate that License Service Reporter did not receive any data for the selected metric in the selected reporting period. If you know of the products that should be reported, make sure that you configured License Service and enabled data feeds for the proper clusters. For more information, see Configuring data sources.
Retrieving the highest license usage for your multicluster environment with API
You can retrieve the highest license usage for your multicluster environment from License Service Reported with one of the dedicated APIs. For more information, see Retrieving license usage data for multiple clusters from License Service Reporter.